Overview
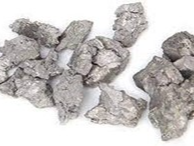
Zirconium (chemical symbol Zr) is a metal recovered from zircon (zirconium silicate, ZrSiO4) and baddeleyite (zirconium oxide, ZrO2), which are extracted from mineral sands and alkaline complexes, respectively. Approximately 75% of zirconium ore is directly used as zircon, while the remaining is transformed in zirconium oxide and other chemicals, including zirconium metal.
| Global production | Global producers | EU consumption | EU share | EU suppliers | Import reliance |
|---|---|---|---|---|---|
| 6,000t | United States 47% France 21% China 20% Russia 12% | 1,447t | 24% | France 81% United States 13% | 11% |
Values for zirconium metal price is difficult to access.SMM serie for industrial grade zirconium sponge is given below
The production of zirconium comes essentially from deposits of heavy mineral sands, which are primarily exploited for titanium ore and secondarily for zircon (monazite and further minerals). This circumstance makes zircon output and price somewhat dependent on the demand of titania. Australia, South Africa, and China consist the main world producers of zirconium sand the last two decades. The zircon sand need to be processed in order to produce zirconium metal. The remaining content of Hafnium in zirconium metal indicates the metal grade (nuclear for Hf<0.2% or industrial for Hf>0.2%). United States, France, China and Russia are the main zirconium metal producers, while France remains the major supplier for EU, whith the United States in second position.
Overall end-of life recycling input rate (EoL-RIR), considering each application share, could be indicated around 12%. Zirconium included in ceramics, refractories, pigments and alloys cannot be recovered as zirconium compounds. A number of European recycling companies report the Zr recycling contained in: metallic rods, tubes, round bolts, rods, heat exchangers, crystal bars, sputter targets and zirconium alloys (buss-spezialmetalle.de, rsrecycling.eu), however, there are no data concerning the recycling methodologies and the end-product.
One of the most famous and crucial of these high-temperature applications is in the nuclear power industry, where zirconium cladding is used to shield fuel rods. Zirconium is also used in superalloys, the construction of missile components, and in space vehicles.
| Use | Percentage | Substitute | Sub share | Cost | Performance |
|---|---|---|---|---|---|
| nuclear | 90% | no substitute | 100% | No substitute | |
| superalloys and other | 10% | no substitute | 100% | No substitute |
Zirconium compounds find special applications in the manufacturing sector that makes substitution difficult, also because in most cases the alternatives are raw materials with higher price and/or lower production.
The supply of zirconium faces several challenges. Many mining operations report declining grades of zircon in their deposits, which complicates extraction processes and escalates production costs. Moreover, geopolitical risks further disrupt supply chains, affecting the stability and availability of zirconium.
The expansion of the nuclear power industry is expected to accelerate market growth. Growing demand from the military, aerospace, aeronautics, and automotive sectors is also expected to accelerate market growth in the next ten years.
The level of toxicity and phytotoxicity associated with Zr is moderately low. Yet Zr is also observed to potentially significantly reduce plant growth and affect plant enzyme activity. Moreover, zircon is a naturally occurring radioactive material (NORM) and as such is subject to a variety of regulations around the world.
Market analysis, trade and prices
| Global production | Global producers | EU consumption | EU share | EU suppliers | Import reliance |
|---|---|---|---|---|---|
| 6,000t | United States 47% France 21% China 20% Russia 12% | 1,447t | 24% | France 81% United States 13% | 11% |
Given the lack of available data on the zirconium metal market, end-of-life products and recycling, a number of assumptions should been made and the reliability of the results is limited. Recent market data, global and for Europe, disaggregated from zirconium ores, zirconium compounds and zirconia, are not easy to access.
Zirconium (together with hafnium) appears in nature as mineral zircon (ZrSiO4) in a a ratio of about 50 for zirconium to 1 for Hf, and less abundantly in the form of baddeleyite (ZrO2) [Xu, L., et al.,2015]. Zircon is retrieved as by-product of the mining of titanium minerals, ilmenite and rutile, or tin minerals [USGS (Zr Hf),2021] [Sverdrup,2023]. Ceramics, foundry sand, opacifiers, and refractories were the leading end uses for zircon, and other end uses included abrasives, chemicals, metal alloys, and welding rod coatings. The leading consumers of zirconium metal are the chemical process and nuclear energy industries [USGS,2025z]. For nuclear applications, the production of zirconium metal comprises ore cracking, hafnium separation, calcination, pure chlorination and reduction to the pure metal [Xu, L., et al.,2015]. According [Sverdrup (Zr Hf) ,2024], the zirconium metal global production was approximately 35,000 ton in 2008, 48,000 ton in 2018, 48,000 ton in 2019, and about 65,000 ton in 2023.
In this FS, we are focusing in zirconium metal. Within the period between 2019 and 2023 (Table 3), 6,000 tons were produced in average each year and 1,539 ton were consumed in the EU (the EU share is around 26% of the global production). The United states (47%) with France (21%), China (20%) and Russia (12%) are the main global producers for processed zirconium metal, while France is the main EU supplier with 72% of the EU market due to it's production for nuclear applications. The major source of EU import is US (17%), UK (3%) and China (3%). The import reliance is about 18% for zirconium metal at processing stage, which represent a low import dependancy, while it's 100% for zirconium at extraction stage.
Comments on Zr Yvon Millet
France production is 1500 mt ?
Zirconium metal production : 6000t is more relevant than 65000t which include zircon
Recycling is performed by producer for its own scrap and with contract with the customer who manufacture nuclear fuel. Scrap as solid revert : pieces of sheet, tubes and bars, probably no chips from external supplier.
Separation of hafnium also done by distillation of chlorides
Zr metal also used for medical application
First validation WS
Zirconium = Metal
Zirconia = Oxide
Zircon = Ore (from titanium ore) ==> Different FS
Production - Zircon extraction ==> 95% ceramic (abrasives) and ~5% Mainly zirconium metal and zirconium compounds

WMD and USGS trends are OK (converted in metal content) - 50-70 % of Zr metal (55% as an average in concentrate)

Namibia and Gambia should appear (maybe in others?) - Check the export from the country
Africa ~Australia OK
| Processing/refining | |
|---|---|
| CN Code | Title |
| 810921 | Zirconium; unwrought, powders, containing less than 1 part hafnium to 500 parts zirconium by weight |
| 810929 | Zirconium; unwrought, powders, containing not less than 1 part hafnium to 500 parts zirconium by weight |
| 810931 | Zirconium; waste and scrap, containing less than 1 part hafnium to 500 parts zirconium by weight |
| 810939 | Zirconium; waste and scrap, containing not less than 1 part hafnium to 500 parts zirconium by weight |
| 810991 | Zirconium; other than unwrought, n.e.c. in heading no. 8109, containing less than 1 part hafnium to 500 parts zirconium by weight |
| 810999 | Zirconium; other than unwrought, n.e.c. in heading no. 8109, containing not less than 1 part hafnium to 500 parts zirconium by weight |
Zirconium processing stage EU consumption is presented by HS code CN 81092000 for unwrought, powders, CN 81093000 for waste and scrap and CN 81099000 for other zirconium articles. Each CN code is divided in zirconium containing less than 1 part hafnium to 500 parts zirconium by weight, which correspond to nuclear grade zirconium with Hf < 0.2% (81092100 = ~10% ; 81093100 = ~70% ; 81099100 = ~40%) and zirconium containing not less than 1 part hafnium to 500 parts zirconium by weight, which correspond to industrial grade zirconium with Hf > 0.2% (81092900 = ~90% ; 81093900 = ~30% ; 81099900 = ~60%). Import and export data is extracted from Eurostat Comext [Eurostat Comext,2022]. According the Observatory of Economic Complexity [The Observatory of Economic Complexity,2025] , in 2023 :
Global trade of Zirconium powders (<1:500 Hf:Zr ratio) reached $60.9M, reflecting a 2.66% decrease from 2022, when trade totaled $62.6M. Global trade of Zirconium powders (≥1:500 Hf:Zr ratio) reached $39.7M, reflecting a 4.54% increase from 2022, when trade totaled $37.9M. The leading exporters of Zirconium powders (<1:500 Hf:Zr ratio) were China (41.8%), United States (39.2%), and France (6.49%), compared to Germany (49.1%), France (14.1%), and United States (12.5%) for zirconium powders (≥1:500 Hf:Zr ratio). In the same year, the main importers of Zirconium powders (<1:500 Hf:Zr ratio) were France (32.6%), United States (22.7%), and Sweden (15.9%), compared to United States (18.6%), Germany (13.3%), and Czechia (7.9%) for Zirconium powders (≥1:500 Hf:Zr ratio).
Global trade of Zirconium scrap (<1:500 Hf:Zr ratio) eached $8.5M, reflecting a 11.4% decrease from 2022, when trade totaled $9.6M. Global trade of Zirconium scrap (≥1:500 Hf:Zr ratio) reached $9.85M, reflecting a 63.5% increase from 2022, when trade totaled $6.02M. The leading exporters of Zirconium scrap (<1:500 Hf:Zr ratio) were United States (48%), United Kingdom (15.4%), and France (11.9%), compared to United Kingdom (54.7%), United States (20%), and Germany (7.05%) for zirconium scrap (≥1:500 Hf:Zr ratio). In the same year, the main importers of Zirconium scrap (<1:500 Hf:Zr ratio) were Belgium (28.1%), Japan (11.7%), and United States (10.6%), compared to Australia (45.4%), Japan (22.7%), and Netherlands (5.44%) for Zirconium scrap (≥1:500 Hf:Zr ratio).
Global trade of miscellaneous zirconium articles, excluding unwrought zirconium (<1:500 Hf:Zr ratio) eached $250M, reflecting a 25.4% increase from 2022, when trade totaled $199M. Global trade of miscellaneous zirconium articles (≥1:500 Hf:Zr ratio) were United States (20.8%), South Korea (17.3%), and Germany (10.9%). The leading exporters of miscellaneous zirconium articles (<1:500 Hf:Zr ratio) were France (52%), United States (39.2%), and Sweden (1.86%), compared to United States (47.9%), France (9.74%), and China (7.24%). for miscellaneous zirconium articles (≥1:500 Hf:Zr ratio). In the same year, the main importers of miscellaneous zirconium articles (<1:500 Hf:Zr ratio) were United States (20.8%), South Korea (17.3%), and Germany (10.9%), compared to Canada (19.5%), United States (14.2%), and Sweden (12.5%) for miscellaneous zirconium articles (≥1:500 Hf:Zr ratio).
First validation WS
26151000 ==> 55% of metal content
waste and scrap - 100% of metal content
Zirconium powder - fine particles (included in FS) - 100%
Ashes 100% zirconia ==> 67% Zr metal (not in FS) - disposed (internal recycling in mind)


Figure 5 shows the EU trade in Zirconium; unwrought, powders, containing less than 1 part hafnium to 500 parts zirconium by weight, between 2002 and 2021. The EU was a net exporter up to 2010, and then became mainly a net importer: EU imports varied from 1.2 t (2002) to 69.2 t (2014); EU exports ranged between 5.1 t (2013) and 45.1 t (2009). Imports significantly increases probalably linked with some lower needs of nuclear grade zirconium especialy in France (and then a decrease in processed Hf processed nuclear grade zirconium production). Figure 6 presents the associated average EU imports, by country, for the same period. Up to 2015 EU imported unwrought Zr mainly from UK with a peak in 2014, then the UK imports significantly decreased. The imports increase from the US started in 2011 and from china in 2016.
Figure 7 shows the EU trade in Zirconium; unwrought, powders, containing not less than 1 part hafnium to 500 parts zirconium by weight, between 2002 and 2021. The EU was a net exporter up to 2010, and then became mainly a net importer: EU imports varied from 8.8 t (2002) to 501 t (2014); EU exports ranged between 37.1 t (2013) and 327 t (2009). Figure 8 presents the associated average EU imports, by country, for the same period. Up to 2015 EU imported unwrought Zr mainly from UK with a peak in 2014, then the UK imports significantly decreased. The imports increase from the US started in 2011 and from china in 2016.
Figure 9 shows the EU trade in Zirconium; other than unwrought, containing less than 1 part hafnium to 500 parts zirconium by weight, between 2002 and 2021. The EU was a net exporter up to 2006, and then became mainly a net importer: EU imports varied from 65.4 t (2015 - maybe due to excess of imports in 2014) to 808 t (2014); except for 2014 and 2016, imports are quite stable around 150 t / year in average. EU maximum exports was about 485 t in 2004; the exports then droped in 2006 and has stabilized around 100 t/year in average since then. Figure 10 presents the associated average EU imports, by country, for the same period. Up to 2015 EU imported Zr other than unwrought mainly from the US during the all period. In 2014 and 2016, the UK becames a significant importer for the EU.
Figure 11 shows the EU trade in Zirconium; other than unwrought, containing not less than 1 part hafnium to 500 parts zirconium by weight, between 2002 and 2021. The EU was a net exporter up to 2006, and then became mainly a net importer: EU imports varied from 111 t (2015 - maybe due to excess of imports in 2014) to 1375 t (2014); except for 2014 and 2016, imports are quite stable around 200 t / year in average. EU maximum exports was about 827 t in 2004; the exports then droped in 2006 and has stabilized around 200 t/year in average since then. Figure 12 presents the associated average EU imports, by country, for the same period. Up to 2015 EU imported Zr other than unwrought mainly from the US during the all period. In 2014 and 2016, the UK becames a significant importer for the EU.
Figure 15 shows the EU trade in zirconium; waste and scrap, containing less than 1 part hafnium to 500 parts zirconium by weight, between 2002 and 2021. The EU was a net net importer the all period of time: the imports are quite stable around 200 t / year in average, while the exports arerages around 40 t / year. Figure 16 presents the associated average EU imports, by country, for the same period. The Canada and the US are the main importers for the EU, with a significant increase of the imports from the US since 2018 which correspond to the import decrease from the Canada. Russia was also an important contributor up to 2009.
Figure 17 shows the EU trade in Zirconium; waste and scrap, containing less than 1 part hafnium to 500 parts zirconium by weight, between 2002 and 2021. The EU was a net net importer the all period of time: the imports are quite stable around 80 t / year in average, while the exports arerages around 15 t / year. Figure 18 presents the associated average EU imports, by country, for the same period. The Canada and the US are the main importers for the EU, with a significant increase of the imports from the US since 2018 which correspond to the import decrease from the Canada. Russia was also an important contributor up to 2009.
Reliable data for zirconium metal prices and production amounts are difficult to find. According to [Sverdrup (Zr Hf) ,2024], metal prices data for zirconium before 1958 are not publicly available. The observed price shows a considerable spread, indicating a regulated market affected by military use. Prices for ZrO2 are available since 1928 and 1940 for zirconium metal, from the USGS website. There was no functioning trade market for zirconium before 1960 outside the nuclear energy industry and military contracts. Until then the production and price was determined by military needs and closed governmental contracts. The use of zirconium metal has been limited by the high production price, which originates from energy-demanding, complex and expensive manufacturing processes.
According to the United States Geological Survey, global mine production of zirconium mineral concentrates increased by 4% to an estimated 1.5 million tons gross weight in 2024 [USGS,2025z]. Global demand for zircon sand in 2019 was 1.2 Mt and the annual growth rate of demand was estimated at 2.7% until 2023. Most zirconium is mined in Australia and South Africa (2023), but it occurs in very many places and there are technically extractable in many other locations. Thus, with increased demand and price, new suppliers will appear in the future [Sverdrup (Zr Hf) ,2024]. However, the supply of zirconium faces several challenges that are becoming increasingly acute. Many mining operations report declining grades of zircon in their deposits, which complicates extraction processes and escalates production costs. Moreover, geopolitical risks such as trade restrictions and civil unrest in critical mining regions further disrupt supply chains, affecting the stability and availability of zirconium. These issues have compelled leading producers like Iluka Resources, Kenmare Resources, and PYX Resources to increase prices, particularly for the premium grades that are crucial for high-end applications [SFA-Oxford (Zr),2025].
Zircon sand is mainly used in ceramic applications, to bind organic and inorganic binders. It is widely used for its high refractive index, durability and toughness, and high thermal conductivity compared to silica sand. Growing demand from the ceramics industry is expected to accelerate market growth [Business research insights (Zr),2025].
The global zirconium metal market will be valued at US$0.539 billion in 2025 and is expected to reach US$0.851 billion by 2034, representing growth of 5.2%. The expansion of the nuclear power industry is expected to accelerate market growth. According to the World Nuclear Association (WNA), 10% of the world's electricity is generated by nuclear power. According to the International Atomic Energy Agency (IAEA), 32 countries operate nuclear reactors worldwide, driving steady growth in demand, as over 70% of reactor cladding materials rely on zirconium alloys. Asia-Pacific is expected to hold the largest market share for zirconium due to growing interest in nuclear resource development. The increasing use of this product in surface coatings for protecting metal surfaces from high temperatures is expected to drive the adoption of zirconium. Growing demand from the military, aerospace, aeronautics, and automotive sectors is also expected to accelerate market growth in the next ten years. The Aerospace Industries Association (AIA) notes that over 35% of advanced aerospace alloys incorporate zirconium-based compounds to improve high-temperature resistance, driving demand from the defence and aviation sectors. This metal exhibits a high burning rate and high heat [Business research insights (Zr),2025].
First validation WS
Demand forecast
internal framatom data ==> up to 2050
Nuclear 8000t capacity
2040 for EU Zr metal 33% increase of capacity
No big changes world wide in terms of capacity - China could double the production - US won't change - Russia market ? (Chinese Zr nuclear grade is provided to Russia for war)

Demand
Zirconium processing stage EU consumption is presented by HS code CN 81092000 and 81099000 unwrought zirconium, zirconium powders. Import and export data is extracted from Eurostat Comext (2021). Global zirconium metal production at the processing stage is estimated at 6000 tonnes per year. The share of zirconium metal consumed annually in the EU is around 1,539t (26%) (Table 3 - Average 2019-2023) and it's mainly used in nuclear applications but also for some specific superalloys, used in corrosive environnments.
Zirconium metal (processing stage) apparent EU consumption, between 2000 and 2023, is shown in Figure 20. The demand was negative up to 2006 due to a significant export contribution. The demand remains low up to 2014 and stabilised around 1500 t/year in averge between 2017 and 2023. According [EDGI,2025], in 2018 The three top EU importers of zircoium metal were France (3246 tonnes), Germany (942 tonnes) and Belgium (372 tonnes) while the three top EU exporters were Germania (624 tonnes), Sweden (445 tonnes) and Belgium (295 tonnes).
The low average import reliance of 18 %, for zirconium metal at processing stage, is mainly due to the high contribution of France in the EU supply. France, with FRAMATOME is the major EU productor of Zr metal (72% of EU supply), especially at nuclear grade, due to its high implication in production of allys for nuclear reactor.
Zirconium is a transition metal with a grey-white colour and shiny by nature. It is ductile, malleable and soft at room temperature and pressure when in its pure form, but it becomes brittle and hard if it is impure. The element is highly resistant to corrosion by acids, alkalis, salt water and other agents, with the exception of hydrofluoric acid. The boiling point is 4409°C and the melting point of the element is 1855°C. A zirconium vessel could hold completely liquid steel without melting, making this transition metal very useful in high-heat applications, such as crucibles and refractories. Zirconium can be alloyed with other metals to improve the corrosion resistance and melting point of these metals, and this is commonly seen in the superalloys used in jet turbines and rocketry. Alternatively, zirconium can be used to create compounds which display impressive mechanical and chemical properties. It mines from ores, the most common of which is zircon. In some cases, the small amounts of hafnium present with the zirconium must be completely removed. This process is expensive and difficult. Despite appearing to be nonreactive, thanks to its passivation layer, zirconium will combine readily with other elements in the right conditions. Zirconium is commonly made into compounds including zirconia and other ceramics, as well as being combined with various elements to create explosive primers and other industrial components. At high temperatures, zirconium will also react with water [Business Research Insights,2025] [Special Metals Fabrication),2025].
Industry sectors relevant for zirconium demand analysis are described in Table 5 using the NACE sector codes (Eurostat, 2021). The development of gross value added by these sectors since 2011 is shown in Figure 23.
Growing nuclear applications contribute to almost 48% of the total demand for zirconium metal as fuel rod cladding in reactors. Nuclear grade zirconium leads with a 57% share, while industrial grade contributes 43%, showing balanced but nuclear-focused applications. More than 35% of leading zirconium companies have invested in expanding their nuclear-grade capabilities after 2021 to meet growing energy demand [Business research insights (Zr),2025].
First validation WS
Applications - EU - Zirconia and zirconium
Zirconium metal - nuclear / superalloy ==> Increase to 5 % (included : safety in automotive, ignate in ai bags - explosive military applications)
Ceramics (mainly abrasivs) - 50%
Chemicals 10%
Pigments 1-2% ok

| Applications | 2-digit NACE sector | Value added of NACE 2 sector | 4-digit CPA |
|---|---|---|---|
| nuclear | C32 - Other manufacturing | 70,000M€ | C32 - Other manufacturing |
| superalloys and other | C24 - Manufacture of basic metals | 74,046M€ | C24 - Manufacture of basic metals |
Zirconium is used for a range of applications. In alloy form, it is used in superalloys and the construction of missile components, and in space vehicles which require high resistance to heat. In powder form, it is commonly a constituent of explosives and primers for explosives, and its immense heat resistance makes it ideal for use in furnaces, smelters and other extremely high-heat applications. One of the most famous and crucial of these high-temperature applications is in the nuclear power industry, where zirconium cladding is used to shield fuel rods [Special Metals Fabrication (Zr),2025].
The nuclear industry accounts for 90% of uses. It is used in the form of alloys (Zircaloy 2 and 4 or ASTM 704) free of hafnium and containing 1.45% tin for the production of fuel cladding [Elementarium (Zr),2024]. Hafnium-free zirconium metal is used as cladding for nuclear fuel rods and for structural materials in nuclear reactors. The very low neutron-capture cross section ability of zirconium means that the high-energy neutrons which propagate the nuclear chain reaction are unable to penetrate the cladding, and therefore that the reaction can be controlled and the fuel introduced when it is appropriate to do so, avoiding the reaction becoming too powerful at any one time [Special Metals Fabrication (Zr),2025]. A typical composition of nuclear-grade zirconium alloys is more than 95% by weight zirconium and less than 2% of tin, niobium, iron, chromium, nickel and other metals, which are added to improve mechanical properties and corrosion resistance [Zircon Industry Association,2025]. Nuclear grade zirconium holds around 57% of the global market share, compared to 43% for industrial grade [Business Research Insights,2025].
Zirconium, once all the hafnium has been successfully removed from it, is used as cladding for nuclear fuels, protecting it from the reaction until it is needed. This is largely due to two attributes of zirconium, which make it especially useful in nuclear reactors. The most important attribute of zirconium for its use in nuclear fuel cladding is its very low neutron capture cross-section ability, which means that the high-energy neutrons which drive the nuclear chain reaction cannot penetrate the cladding to cause a fission reaction in the clad fuel. This stops the chain reaction growing out of control, and ensures that the nuclear reactor works only at the rate which its operators decide. It is vitally important to remove all the hafnium from the material before it is used in nuclear fuel cladding. This is often a complex procedure, as hafnium is a very closely related element with many similar properties to zirconium, bar one: it has a very high neutron capture cross-section, making it extremely ineffective as a shield against the high-energy neutrons found in a nuclear reaction. The other key feature of zirconium that makes it work for nuclear cladding is its high melting point, as high as 1,855°C, which means that it can hold up to the conditions within the reactor, at temperatures where even steel would melt [Special Metals Fabrication (Zr),2025].
Zirconium metal is used in superalloys. Especially hafnium-bearing zirconium metal is used in specialty alloys and for application in corrosive environments. For non-nuclear applications, which accounts for 10% of uses, the hafnium content typically ranges from 0.2 to 4.5%. The zirconium used in these applications generally comes from manufacturing scraps of zirconium developed for nuclear applications and recycled zirconium [Elementarium (Zr),2024]. Non-nuclear or industrial grade, with a minimum of 0.2% hafnium, is used to produce zirconium alloys for applications such as chemical processing. ASTM allows 0.4-0.5% hafnium in zirconium alloys [Zircon Industry Association,2025].
For exemple [Elementarium (Zr),2024]: Zirconium alloys containing 2.5% niobium (ASTM alloys 705 and 706) are used in the chemical industry;Titanium alloys with 6% Al, 2% Sn, 4% Zr, and 2% Mo, are used in aeronautics; and the Cu-Cr-Ni-Zr alloy is used to replace the Be-Cu alloy in electrical contacts.
| Use | Percentage | Substitute | Sub share | Cost | Performance |
|---|---|---|---|---|---|
| nuclear | 90% | no substitute | 100% | No substitute | |
| superalloys and other | 10% | no substitute | 100% | No substitute |
Zirconium compounds find special applications in the manufacturing sector that makes substitution difficult, also because in most cases the alternatives are raw materials with higher price and/or lower production [European Commission,2017].
First validation WS
chemicals - Acetic acid
Zr->Ti not ok
Stainless steal but the life time decreas
Pigment
Add TiO2 (pure white) - ZrO2 for laboratory, fit with alumina
Nuclear - % to be correct
Superalloy : Nb, Ta, Hf

In nuclear applications, niobium (columbium), stainless steel, and tantalum offer partial substitutes for Zirconium metals [SFA-Oxford (Zr),2025].
Zirconium can be used interchangeably with hafnium in certain superalloys. Titanium and synthetic materials serve in certain chemical processing plants.Titanium's corrosion resistance and strength-to-weight ratio make it a viable substitute for zirconium in select applications, particularly where lightweight materials are advantageous. Magnesium alloys can be potential replacements for zirconium in aerospace components due to their lightweight and mechanical properties. Rare earth elements, including lanthanum, neodymium, and yttrium, are used as substitutes or additives in speciality alloys and ceramics employed by zirconium. Carbon composites like carbon fibre reinforced polymers provide lightweight and high-strength properties, making them suitable alternatives to zirconium in aerospace and automotive applications [SFA-Oxford (Zr),2025].
Supply
Zirconium (together with hafnium) appears in nature as mineral zircon (ZrSiO4), and less abundantly in the form of baddeleyite (ZrO2) [Xu, L., et al.,2015]. Zircon is retrieved as by-product of the mining of titanium minerals, ilmenite and rutile, or tin minerals. The main uses of zircon are refractories, foundry sands, and ceramic opacification [USGS (Zr Hf),2021]. In the EU, the only zirconium mineral is produced in Ukraine, with 22000t produced in 2019, 14100t in 2022 (1-2% of the global production of zircon concentrate) [WMD,2024] [RMIS,2025] [Ganzha et al. ,2025].
The zirconium metal market is draven by nuclear applications. For nuclear applications, the production of zirconium metal comprises ore cracking, hafnium separation, calcination, pure chlorination and reduction to the pure metal [Xu, L., et al.,2015]. The main processing insdustry for zirconium metal production is located in France (Framatome) and is the main EU supplier (72% - Table 1). The top list of worldwide Zirconium Metal Companies includes : ATI Metals (U.S.), Western Zirconium (U.S.), Framatome (France - U.S.), Chepetsky Mechanical Plant (Russia), State Nuclear Baoti Zirconium (China), Guangdong Orient Zirconic (China), CNNC Jinghuan (China), Nuclear Fuel Complex (India), Liaoning Huagao New Material (China). According to the U.S. Department of Energy, ATI supplies zirconium alloys used in over 60% of nuclear reactors operating across North America. As per China’s National Energy Administration, Baoti provides zirconium products for more than 75% of domestic nuclear projects, making it a strategic supplier in Asia Pacific [Business research insights (Zr),2025].
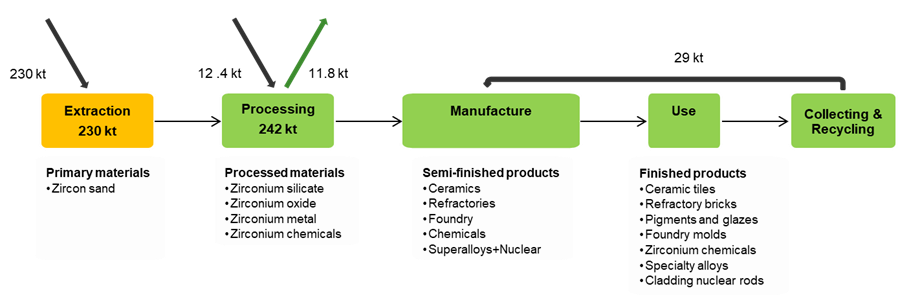
The production of zirconium comes essentially from deposits of heavy mineral sands, which are primarily exploited for titanium ore and secondarily for zircon (monazite and further minerals). About half the mineral production came from unconsolidated sediments in 2020, titanium and tin mining give important contributions to the extraction of zirconium. In the process of taking zirconium from the ore, zirconium oxide is reacted to dissolved zirconium tetrachloride is made. Zirconium metal is made by reacting the zirconium tetrachloride with magnesium in what is called the Kroll process. There is some recycling of zirconium metal, but the chemicals and oxides are normally not recycled [Sverdrup (Zr Hf) ,2024].
Zirconium is predominantly supplied by a handful of countries with significant mineral reserves. The major zirconium-producing countries are Australia, South Africa, China, and Indonesia. These nations are complemented by substantial reserves found in India, Mozambique, and Sri Lanka, making them key players in the global zirconium market. The current landscape of zirconium mineral producers is extensive, indicating a diverse global footprint. In addition to the major producers, countries like Kenya, Ukraine, Madagascar, Nigeria, Senegal, the United States, Brazil, Malaysia, Russia, Vietnam, Sierra Leone, and Sri Lanka also contribute to the global supply. This wide distribution of production capabilities helps to somewhat mitigate the supply risk, although the concentration in certain regions still poses significant challenges. Historically, many of these nations have been involved in the production of zirconium minerals for decades, establishing a long-standing tradition and expertise in the extraction and processing of this critical material. As the demand for zirconium continues to grow, driven by its applications in areas such as nuclear energy, advanced ceramics, and aerospace technologies, the importance of securing a stable and efficient supply chain becomes even more pronounced. Efforts to enhance mining techniques, expand into new reserves, and improve geopolitical relationships are essential to maintaining the steady flow of zirconium on which so many industries depend [SFA-Oxford (Zr),2025].
Zirconium seldom alone as primary deposits (zirconia) and mostly in combination with ilmenite, rutile, carbonatite rocks, along iron ores in intrusive formations, in monazite sands and multi-metal ores. Zirconium occur together with titanium and zirconium bearing minerals like ilmenite (FeTixZr(1-x)O3) where x is variable depending on the deposit), zirconia mineral (ZrSiO4) and in the carbonatite type of polymetallic ores, often associated with contents rare earths, thorium, uranium and yttrium. Many deposits have a mixture of ilmenite, rutile and zirconia, and the zirconia component can be substantial. The mineral zircon (ZrSiO4) is resistant to any type of corrosion and single crystals are preserved for millions of years in the natural environment [Sverdrup (Zr Hf) ,2024].
Zirconium deposits exploit concentrations of zircon (ZrSiO4) or baddeleyite (ZrO2) of economic importance [Minerals4EU,2019]. Other zirconium minerals (e.g., eudyalite, zirkelite, vlasovite, etc) are rare and never reach a concentration high enough to be commercially significant. Zircon is a common accessory mineral in most igneous rocks, especially in granitic suites and corresponding metamorphics, where it is usually present in small amount. Nevertheless, being highly resistant to weathering and physical degradation, zircon tends to be enriched in some sedimentary rocks, particularly in river and beach sands, where it can be found in the heavy minerals fraction (together with tourmaline, rutile, ilmenite, leucoxene, etc). Such placer deposits are essentially located along coastlines of stable cratons, where the action of the waves for long time gave rise to sands enriched in heavy minerals (up to 10-20%). Both strand line (active or fossil beaches) and aeolian dune deposits are exploited. In these deposits, zircon is always associated to titanium minerals, which represent the main target of mining operations. The zircon-to-rutile ratio is on average 1:5, even though it can be sometimes higher, up to 2:1 [ILUKA,2014]. Deposits in operation are along the coasts of Australia, Africa, southern Asia and the Americas. Baddeleyite deposits are very rare and found only in peculiar alkaline igneous complexes: Kovdor in the Kola Peninsula (Russia), Poço de Caldas, Minas Gerais (Brazil), and Phalaborwa (South Africa) [USGS Professional Paper 1802,2017].
| Country | Resources (tonnes) |
|---|---|
Identified world zirconium resources mostly consist of zircon placers and major deposits are preferentially distributed in the Austral hemisphere (Australia, South Africa) and southern Asia (India, China) [USGS,2019]. Zirconia resources are mainly known from Australia, South Africa and India [Sverdrup (Zr Hf) ,2024]. Resources of zircon in the United States included about 14 million tons associated with titanium resources in heavy-mineral-sand deposits. Phosphate rock and sand and gravel deposits could potentially yield substantial amounts of zircon as a byproduct [USGS,2025z].
| Country | Zircon reserves (thousand tonnes) - USGS 2025 |
|---|---|
| Australia | 55000 |
|
South Africa |
5300 |
| Senegal | 2600 |
| Madagascar | 2100 |
|
Mozambique |
1500 |
| USA | 500 |
| Sierra Leone | 290 |
| China | 72 |
|
Kenya |
5 |
| Others | 5700 |
| World Total | >70000 |
In 2025, world known zircon reserves are estimated at approximately 70 million tonnes of ZrO2 content. Australia has the world’s largest zirconium reserves (approximatly 79 % of the global reserve), followed by South Africa (8%) [USGS,2025z].
| Country | Classification | Quantity (Mt of ore) | Grade (% Zirconium metal) | Reporting code | Reporting date | Deposit, Source | ||
|---|---|---|---|---|---|---|---|---|
Some zirconium resources are known in the EU from the Minerals4EU website: zircon placers and alkaline or felsic igneous rocks, along with bauxite deposits and polymetallic mineralizations (e.g., U-Zr). However, further occurrences surely exist in other countries, not covered by this database. In most cases, we are dealing with occurrences, as just the zircon sand placers are classified as deposits. Overall, these resources cannot be summed because no quantitative estimation is available for reserves [Minerals4EU,2019]. Leading Edge Materials Company estimates that about 10,200 tonnes of zirconium dioxide are going annually to be produces through the metallurgical processing of Norra Karr REE deposit in Sweden [Leadingedgematerials,2021]. Zirconium dioxide will be produced as a mixture with REOs and Nb oxide after the leaching and the solvent extraction stages. The potentially exploitable Kringlerne REEs deposit in Greenland contains a significant amount zircon. Kringlerne is located in the southern part of the IlÍmaussaq Complex, containing eudialyte-group minerals and their alteration products (notably catapleiite and nacareniobsite-(Ce)) as the main target minerals. The inferred resources have been estimated at 4300 Mt with a 1.8 wt.% Zr2O5 content [Goodenough et al.,2016].
| Country | Classification | Quantity (Mt of ore) | Grade (% Zirconium metal) | Reporting code | Reporting date | Source | ||
|---|---|---|---|---|---|---|---|---|
The production of zirconium comes essentially from deposits of heavy mineral sands, which are primarily exploited for titanium ore and secondarily for zircon (monazite and further minerals). This circumstance makes zircon output and price somewhat dependent on the demand of titania. The following companies are the major producers of primary zirconium concentrates [Zircomet,2020] : Iluka's zircon production is mainly from it's Jacinth-Ambrosia mine in south Australia; Rio Tinto owns Richards Bay Minerals in South Africa; Tronox/Cristal owns mines in both South Africa and Australia; Kenmare owns the Moma mine in Mozambique; TiZr operates a mine in Senegal.
The primary zirconium production (mainly zircon) by country are available on Zironium mineral factsheet (yet to come). Australia, South Africa, China, Mozambique, Senegal and Indonesia consist of the main world producers of zirconium sand. The global demand for zircon sand in 2019 was 1.2 Mt. The annual growth rate in demand estimated to increase to 2.7% until 2023. Zirconium oxide demand is expected to increase by 3-6% until 2025. On the other hand, the supply annual growth forecast until 2025 is -3.6%. Additionally, there is currently a general lack of quality mineral sand projects, particularly with high zircon assemblage, and a depletion of existing operations. The zirconium compounds is planned to overcome via substitution actions [Zircomet,2020]. Advanced exploration and development projects with planned production of zircon concentrates are taking place in Australia, Madagascar, Mozambique, Senegal, Tanzania, and elsewhere. In the United States, mining and heavy-mineral-processing operations were expanded near Starke, FL, and prefeasibility studies were underway at the Titan heavy-mineral-sands project near Camden, TN [U.S. Geological Survey,2022].
Global mine production of zirconium mineral concentrates increased by 4% to an estimated 1.5 million tons gross weight in 2024. Several companies continued exploration and development projects with planned production of zirconium mineral concentrates in Australia, Mozambique, South Africa, Sri Lanka, Tanzania, and elsewhere. The leading global exporters of zirconium mineral concentrates were Australia and South Africa. China was the leading importer of zirconium mineral concentrates; China’s imports included zircon in mixed and separated heavy-mineral concentrates. U.S. imports of zirconium mineral concentrates continued to decrease in 2024, whereas exports increased. Australia, Senegal, and South Africa were still the leading import sources of zirconium mineral concentrates [USGS,2025z]. In the EU, the only zirconium mineral is produced in Ukraine, with 22000t produced in 2019, 14100t in 2022 (1-2% of the global production of zircon concentrate) [World Mining Data,2024] [RMIS,2025] [Ganzha et al. ,2025].
Overall end-of life recycling input rate (EoL-RIR), considering each application share, could be indicated around 12% [SCRREEN workshop,2019]. Zirconium included in ceramics, refractories, pigments and alloys cannot be recovered as zirconium compounds. However, when refractories and steel alloys are recycled the zirconium remains in the recycled product. Therefore these recycling rates are applicable also for the zirconium which would results in estimated rate of 70% of zirconium utilized [SCRREEN 2,2020]. Companies in Oregon and Utah recycled zirconium from new scrap generated during metal production and fabrication and (or) from post-commercial old scrap [USGS,2025z].
First validation WS
==> Internally recycled
But End of life recycling is 0% for zirconium metal for EU (and 0% world wide)

| MSA Flow | Value | ||
|---|---|---|---|
EoL-RIR for zirconium is around 12% (but not considering only zirconium metal, but also other zirconium compounds) [CRM,2023]. The nuclear technology metal is completely collected and recaptured, but only very limited recycling for reuse is possible. Some recycling of superalloys have been initiated, but the recycling process is challenging. At present, producers use an extraction cut-off at 2-5% for zirconium [Sverdrup (Zr Hf) ,2024].
A number of European recycling companies report the Zr recycling contained in: metallic rods, tubes, round bolts, rods, heat exchangers, crystal bars, sputter targets and zirconium alloys (buss-spezialmetalle.de, rsrecycling.eu), however, there are no data concerning the recycling methodologies and the end-product. The recycling of Zry-4 scrap alloy (containing Sn) in terms of chemical and microstructure upgrading has been tested using electron beam (EB) and vacuum induction (VIM) technologies. The laboratory-scale results showed that is feasible to obtain alloys having suitable chemical characteristics, microstructure and mechanical properties for various applications in the nuclear area, chemical industry and medicine such as dental prostheses [Pereira et al.,2020]. The recycling (purification) of Zr-containing cladding components in nuclear reactors has been the subject of researches. The purification is performed through chlorination or hydrochlorination, therefore the process could be incorporated into the process of metallic Zr production which involves the formation and purification of ZrCl4 as an intermediate product [Collins et al.,2012]. The involving of the chlorination/hydrochlorination process in the recycling concept, will enable the linking between the recycling and the primary production of metallic cladding hulls which are also produced through a chlorination process as it will be described in the following “processing” subsection.
Heavy minerals sands contain both zircon and titanium minerals (commonly in the 1-10% range by weight). Mining by dredging or dry mining techniques is followed by washing the sand, then concentrates containing 90-95% heavy minerals are separated from the silica sand by wet gravity concentration techniques. Specific processes are employed to get zircon sand: electrostatic separation (typically used for separating zircon from rutile); magnetic separation (zircon from leucoxene, monazite and ilmenite), gravity separation (zircon from kyanite, feldspars and quartz). Iron and aluminum oxide coatings at the surface of zircon grains are removed by hot acid leaching. In some cases, the final product is calcined at approximately 900°C to render the zircon whiter. Zirconia is the main end-product of zircon processing directly suitable for many uses in a variety of ceramics and coatings. The decomposition of zircon by the reaction with sodium hydroxide is the most common method for obtaining the pure oxide [Blanchart, P.,2018]. At temperatures above 600 oC, sodium hydroxide and zircon react to form sodium zirconate and sodium silicate according to the reaction:
ZrO2.SiO2 + 4NaOH → Na2ZrO3 + Na2SiO3 + 2H2O
The sodium silicate is removed by leaching with water and sodium zirconate is hydrolyzed to produce a hydrated Zr hydroxide. The last is calcined to form impure zirconium oxide which is purified by leaching with sulfuric acid.
Alternatively, zirconia is produced via high-temperature processing through the reaction of zircon with lime at 1600 oC according to the reaction [Blanchart, P.,2018]:
2CaO + ZrO2.SiO2 → ZrO2 + CaSiO4
Calcium silicate is removed by leaching with hydrochloric acid, while zirconia is washed and dried.
A small fraction of the mineral zircon is processed to the metallic zirconium, which is mainly used for nuclear applications due to its low neutron-absorption cross-section and excellent corrosion resistance properties. The metallurgical processing of zircon ore for the production of elemental Zr is complex and comprises the main stages of: Carbochlorination, solvent extraction-calcination, Hf separation, pure chlorination and metallothermic reduction to the pure metal [Xu, L., et al.,2015]. Carbochlorination is processed by heating zircon sand and carbon in a fluidized bed at 1200 oC under the fluidizing gas of chlorine. Its product is a mixture ZrCl4 and HfCl4 and liquid silicon tetrachloride which collected as a by-product and used to produce fiber optic cable, fumed silica and silicon metal for PV panels. The separation of hafnium from zirconium is the crucial step of the nuclear grade zirconium production. The commercially used separation methods consist of various hydrometallurgical routes, including fractional crystallization, methyl isobutyl ketone extraction and tributyl phosphate extraction. Fractional crystallization has also been used at some extent.
Other considerations
The level of toxicity and phytotoxicity associated with Zr is moderately low . Yet Zr is also observed to potentially significantly reduce plant growth and affect plant enzyme activity. In a context of increasing amounts of Zr emissions to the environment, more data on the plant-soil behaviour of Zr are needed. This will enable to better understand the mechanisms involved in uptake and phytotoxicity of Zr, and accordingly to better assess the potential health risks associated with Zr-polluted plants consumed by humans [Ghosh S, et al. ,1992] [Shahid M, et al.,2013].
Moreover, zircon is a naturally occurring radioactive material (NORM) and as such is subject to a variety of regulations around the world [Harlow, K. ,2017]. So far little data enables us to accurately quantify the impacts associated with natural ionising radiation during the production phase of zircon sand in Life Cycle Assessment. The NORM issue during the production of zircon sand will be a topic for future research in the LCA field, in terms of reliable data collection and associated assessment of natural occurring radioactivity [Gediga, et al. ,2019]. However, generally, regarding the production of zircon sand, volumes of residues are relatively limited and their activity relatively low [AFCN,2020]. In particular, the measure of the radioactivity in the soil nearby a zircon mineral processing plant, in the North East part of Italy, and the associated estimation of the absorbed dose, showed that the induced radiological impact on the environment and on the population was negligible [Righi, S., et al.,2002].
The use/ban of Zirconium is not restricted under REACH Regulation (EC) No 1907/2006 Annex XVII [Deutsche Forschungsgemeinschaft and Commission for the Investigation of Health Hazards of Chemical Compounds in the Work Area,2002].
Besides impacts associated with natural occurring radioactivity as mentioned above, the production of Zr metal implies a number of other environmental impacts as classically observed for metals. Only a limited number of studies are available in the literature regarding the environmental impacts of Zr production in a Life Cycle perspective. As for other elements in their metallic form (either metals or alloys), the environmental burden associated with the cradle-to-gate production of Zr metal is calculated to be largely due to the refining stage. Considering the 5 impact categories global warming potential, cumulative energy demand, terrestrial acidification, freshwater eutrophication, and human toxicity (cancer and non-cancer), the impact intensity (that is, per kg produced) of Zr (in oxide and metal forms, weighted by the 2008 supply mix) is in the lower range as compared to other elements [Nuss, P. and Eckelman M. J.,2014]. The global warming impact of Zr metal is however in the average range as compared to other elements. Moreover, in a more recent study, the production of 1 kg of zircon sand was calculated to generate 0.32 kg-CO2 equivalent in a life-cycle perspective [Gediga, et al. ,2019].
Technical rules for the use of Zirconium powder (pyrophoric) and Zirconium powder (non-pyrophoric) can be found in the GESTIS Substance database. International limit values for zirconium, zirconium compounds, zirconium dioxide, zirconium powder are non-stabilized and zirconium powder that is stabilized can be found in the GESTIS international limit values database.
Based on 2020 data, only Senegal (2.4 %) and Mozambique (1.4 %) export zirconium whose value represented more than 1 % of the total value of their exports. For Madagascar (0.95 %), Kenya (0.67 %) and South Africa (0.49 %), the value of their zirconium exports were accounting for more than 0.1 % of their total exports. For all other exporting countries, this share remained below 0.1 %.
| Country | Export value (USD) | Share in total exports |
|---|---|---|
No information available that links zirconium to particular social or ethic aspects.
No research and development trends for low-carbon and green technologies concerning zirconium metal have been identified.
No other research and development trends concerning zirconium metal have been identified.