Overview
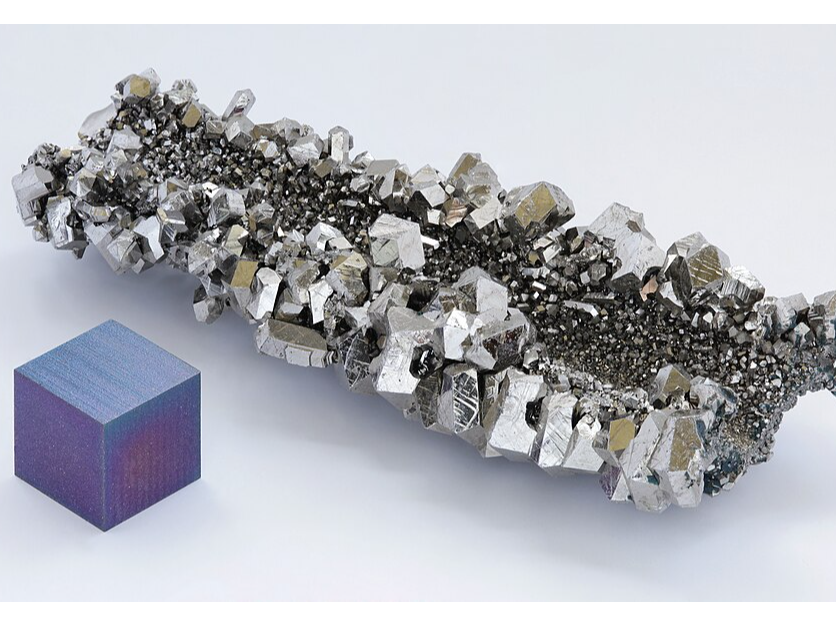
Niobium (chemical symbol Nb) is grey in colour. It is a relatively hard, paramagnetic, refractory transition metal. It has a density of 8.57 g/cm3 and a very high melting temperature (2,468°C). Niobium is also highly resistant to chemical attack and behaves as a superconductor at very low temperature. The upper-crustal abundance of niobium is 12 ppm [Rudnick, R. L. and Gao, S.,2014], which is higher than some of the other refractory metals, but lower than many of the base metals. Niobium is not found as a free metal in nature, but chiefly occurs in minerals such as columbite and pyrochlore, the latter being the primary ore mineral. Some characteristics and properties are similar to other neighbouring elements on the periodic table. This is the case for tantalum, which is located just below niobium on the periodic table and often appears in the same deposits as niobium.
Picture: Wikimedia Commons
| Global production | Global producers | EU consumption | EU share | EU suppliers | Import reliance |
|---|---|---|---|---|---|
| 60,710t | Brazil 89% Canada 11% | 13,227t | 22% | Brazil 85% Canada 13% | 100% |
The price of niobium has been relatively stable in the past years and ranged between 17-24€/kg of ferroniobium in 2019-2024, the average price being 21.8 €/kg of ferroniobium (S&P Global). The prices of niobium pentoxide (Nb2O5) and higher purity and special products are higher [Globe Metals and Mining,-]. In general, the price volatility of niobium is low compared to other critical minerals.
Brazil is the major producer, representing 92% of the global production in 2024, while Canada produced 6%, and Rest of the World 2% of the total mine production [World Mining Data,since 1984]. With the exception of the African countries reporting minor production, companies extracting niobium ores are typically integrated, meaning they also produce processed niobium products, such as niobium oxide, ferroniobium and niobium metal.
In addition to primary extraction, niobium can be extracted as by-product of tin smelter waste, extracted from sludge from the cemented carbide tool industry, or from mill scrap from alloyed and unalloyed metal fabrication, and scrap from industrial alloys and superalloys. Niobium contained in the waste is mostly non-functionally recycled. There is very little post-consumer functional recycling of niobium, and most ends up in slags during recycling of steel, which again is mostly used for construction of roadways, or diluted down, not valued for its functions.
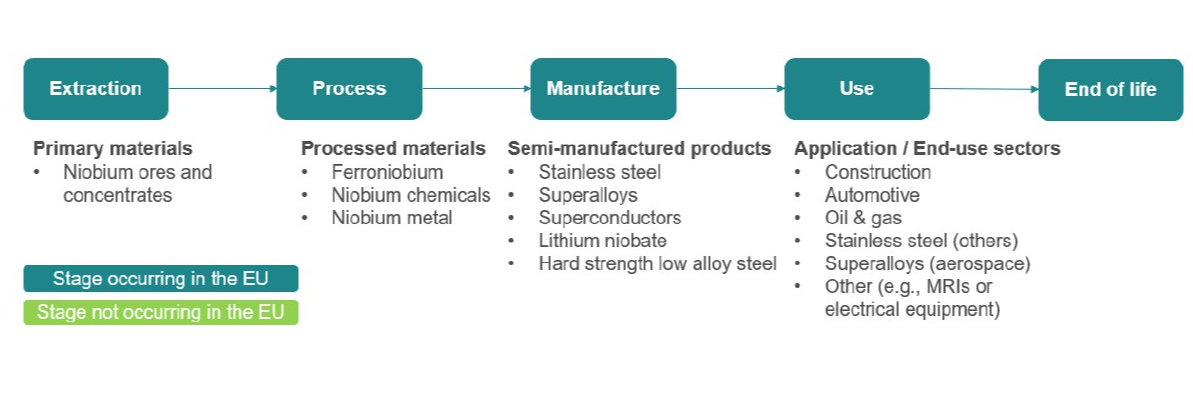
Main use of niobium is as an additive in high strength low alloy (HSLA) steel, stainless steel and other special steels, which are used in various sectors including construction, automotive and other transport (car and truck bodies, ship hulls, railroad tracks), oil and gas pipelines, and tool steels. In addition, niobium materials are used in superalloys, superconductors for MRI, and other applications.
| Use | Percentage | Substitute | Sub share | Cost | Performance |
|---|---|---|---|---|---|
| Construction (Steel) | 31% | No substitute | 70% | No substitute | |
| Construction (Steel) | 31% | Molybdenum | 10% | Similar or lower costs | Reduced |
| Construction (Steel) | 31% | Titanium | 10% | Similar or lower costs | Reduced |
| Construction (Steel) | 31% | Vanadium | 10% | Similar or lower costs | Reduced |
| Automotive (Steel) | 21% | No substitute | 70% | No substitute | |
| Automotive (Steel) | 21% | Titanium | 10% | Similar or lower costs | Reduced |
| Automotive (Steel) | 21% | Molybdenum | 10% | Similar or lower costs | Reduced |
| Automotive (Steel) | 21% | Vanadium | 10% | Similar or lower costs | Reduced |
| Stainless Steel | 17% | Titanium | 50% | Similar or lower costs | Reduced |
| Stainless Steel | 17% | Molybdenum | 50% | Similar or lower costs | Reduced |
| Superalloys | 13% | not assessed under 10% | 100% | No substitute | |
| Oil & Gas | 8% | No substitute | 70% | No substitute | |
| Oil & Gas | 8% | Titanium | 10% | Similar or lower costs | Reduced |
| Oil & Gas | 8% | Molybdenum | 10% | Similar or lower costs | Reduced |
| Oil & Gas | 8% | Vanadium | 10% | Similar or lower costs | Reduced |
In some cases, partial or full substitution of niobium by other minerals is possible depending on the technical, economic, and environmental requirements of each application. These include molybdenum, titanium and vanadium as alloying elements in high-strength low-alloy steels, tantalum, and titanium as alloying elements in stainless and high-strength steels, and ceramic matrix composites, molybdenum, tantalum, and tungsten in high-temperature (superalloy) applications [USGS,2025] [MSP-REFRAM 2021]. However, any substitution would be associated with reduced performance and could involve the use of other raw materials assessed as critical.
World resources of niobium are considered more than adequate to meet current demand, although production is expected to remain highly concentrated in Brazil. Demand is closely linked to the steel industry, particularly HSLA steels used in construction, infrastructure, automotive, and pipeline applications, and global niobium consumption is expected to continue growing towards 2030. In addition to steel, emerging applications such as niobium-based battery materials could further increase demand in the future.
Niobium itself is not radioactive in nature, however, pyrochlore, the most important source of niobium, can contain significantly elevated concentrations of uranium and thorium series radionuclides.
Trade restrictions for niobium ores and concentrates are in place in Brazil, Ethiopia, Nigeria, and South Africa (licensing requirement) and in Burundi and Rwanda (fiscal tax on exports) in 2022 [OECD,2024A].
Market analysis, trade and prices
| Global production | Global producers | EU consumption | EU share | EU suppliers | Import reliance |
|---|---|---|---|---|---|
| 60,710t | Brazil 89% Canada 11% | 13,227t | 22% | Brazil 85% Canada 13% | 100% |
At over 90% of the global production at the extraction stage, Brazil is by far the leading mine producer of niobium and is also the most important producer of processed niobium. Canada as the second largest mine producer accounted for 6% of average annual production (Table 3). Global niobium production comes from three mines, from Brazil and Canada. Companhia Brasileira de Metalurgia e Mineração (CBMM) is the world’s leading producer with its Araxá niobium mine in Brazil. Second largest producer is the Boa Vista mine in Catalão in Goiás, Brazil, owned by China-based CMOC Group. Third largest producer is the Niobec mine in Québec, Canada, owned by Magris Performance Materials. [Gray, O.,2024]. Russia, DR Congo, Rwanda, Nigeria, China, Ethiopia, Mozambique and Burundi also reported minor production in 2022 [World Mining Data,2024]. The Covid-19 pandemic led to a decline in global production in 2020, but in 2021-2022, the production has increased rapidly close to pre-Covid-19 levels.
Niobium minerals are typically converted at the mine site to ferroniobium and other value-added products such as niobium metal and oxide. Ferroniobium is the leading commercial niobium product and most important niobium material traded. Other globally traded niobium materials include niobium metal, ores and concentrates, and scrap [USGS,2021]. Brazil and CBMM is the leading supplier of ferroniobium and niobium metal and oxides worldwide.
Based on BGS, the global production based on ferroniobium was 47,710 t between 2019-2023, and the most important producers Brazil and Canada, with a share of 87% and 13%, respectively. EU share of the global consumption of the processed niobium was 28% at 13,388 t between 2019-2023. The import reliance of EU was 100% for the processing stages.
| Processing/refining | |
|---|---|
| CN Code | Title |
| 72029300 | Ferro-niobium |
| 81129240 | Unwrought niobium 'columbium'; niobium 'columbium' powders |
Relevant Eurostat CN trade codes for niobium are listed in Table 4 and include CN72029300 - Ferroniobium (Nb content 65%), and CN81129240 - Unwrought niobium 'columbium'; niobium 'columbium' powders (Nb content 100%) after 2022 at the processing stage. Until 2021, CN81129231 - Unwrought niobium 'columbium' and rhenium; niobium 'columbium' powders or rhenium powders was in use.
In the absence of a relevant method to disaggregate the share of each element in the annual statistics of the CN code 26159000 - Niobium, tantalum or vanadium ores and concentrates, figures are not presented for the niobium at the extraction stage. Furthermore, it has been estimated that the import of niobium to the EU in the form of ores and concentrates is close zero (Validation Workshop 2026).
Thus, the following analysis only concerns ferroniobium and niobium-columbium powders flows.
Figure 5 and 6 present EU trade flows and imports by country for ferroniobium (CN 72029300).
The EU has been a net importer of ferroniobium from 2000 to 2024. There was a small decline in imports in 2019-2020 due to COVID-19, but the imported amount increased in 2021 and has been relatively stable since. In 2024, the EU imported 13 099 tonnes of ferroniobium, and exported 1 781 tonnes. The major suppliers of the EU of ferroniobium in 2024 were Brazil, and Canada with 86%, and 14% shares of the total supply, respectively.
Figure 7 and 8 present EU trade flows and imports by country for Unwrought niobium 'columbium'; niobium 'columbium' powders (CN 81129240). Trade code CN 81129240 has been created in 2022. Before 2022, CN 81129231 - Unwrought niobium 'columbium' and rhenium; niobium 'columbium' powders or rhenium powders was in use, which combined unwrought and powder niobium and rhenium flows.
The EU has been a net importer of Unwrought niobium 'columbium'; niobium 'columbium' powders in 2022-2024. In 2024, the EU imported 1672 tonnes of unwrought niobium and niobium powders and exported 208 tonnes. The major suppliers of the EU of unwrought niobium and niobium powders in 2024 were Brazil, and Rest of the World with 88%, and 12% shares of the total supply, respectively.
Niobium materials are not traded on exchanges. Purchase contracts are negotiated confidentially between buyer and seller [T.I.C.,2025c].
The annual average price of ferroniobium is presented in Figure 9. The price of niobium has been relatively stable in the past years and ranged between 17-24€/kg of ferroniobium in 2019-2024, the average price being 21.8 €/kg of ferroniobium (S&P Global). The prices of niobium pentoxide (Nb2O5) and higher purity and special products are higher [Globe Metals and Mining,-].
In general, the price volatility of niobium is low compared to other critical minerals, which relates to the durability and reliability of the supply chain as well as for the apparent stability of this market. However, the high degree of market monopolisation, and potential unforeseen production restrictions, may increase price volatility. In addition, increasing consumption of the largest users of niobium, China and Japan, may also influence the niobium market and price growth. [ A., Krzak, M., Szlugaj, J.,2024]
World resources of Nb are considered more than adequate to supply the needs at current usage levels [USGS,2025]. However, Nb is classified as critical due to the high concentration of production. Niobium production will continue to be concentrated in Brazil in the near future.
Market demand for niobium closely follows the steel industry, as most of the world’s niobium is added to steel as ferroniobium. Ferroniobium is typically consumed in the production of high-strength low-alloy (HSLA) steel. Other uses of niobium include the fabrication of nonferrous and niobium alloys and production of niobium carbides and chemicals [USGS,2021]. Ferroniobium can be used as a steel alloy substitute for ferro-vanadium and ferro-manganese. In 2018, as vanadium prices rose sharply, demand for ferroniobium also increased. The growth was due to higher Chinese demand as more stringent standards were enforced for construction materials [Bakry, M., Li, J., Zeng, X. ,2023].
Due to China’s huge niobium consumption driven mainly by the continued expansion of HSLA steels in construction, infrastructure, automotive, and pipeline applications, Nb demand in China is expected to steadily increase until 2030 at 4.0% to 6.0%. At a global level, niobium and FeNb production is forecast to increase by approximately 2.5% to 3.0% annually up to 2030, assuming continued growth in utilization (Figure below). The study suggests that enhanced recycling has some potential, particularly from Nb-containing steel scrap, which is currently underutilized compared to recycling of Nb-based superalloys [Bakry, M., Li, J., Zeng, X. ,2023].

Figure: Forecast of Nb and FeNb global production until 2030 [Bakry, M., Li, J., Zeng, X. ,2023].
In addition to construction, the use of niobium is expected to increase due to the demand for more light weight and fuel-efficient vehicles. It is estimated that by adding 300 grams of niobium in steel for a mid-size passenger car can reduce the vehicle's weight by 200 kilograms, leading to improved fuel economy of 1 liter per 200 kilometers. [Mordor Intelligence,2024b]
Steel has been the major application for niobium, but there are some emerging applications which could increase the demand in the future, such as use of niobium as anode materials in the next generation lithium-ion batteries [Toshiba,2024]. CBMM has announced investments to expand its niobium oxide capacity at Araxá plant in Minas Gerais, Brazil, to reach oxide production capacity to 20,000t by 2030 targeting the battery market [CBMM,2024]. In addition, niobium use in other smaller-volume but strategically important segments, such as superalloys and niobium carbides used in high-performance alloys, cutting tools, and wear-resistant materials, is expected to increase also in the future [Bakry, M., Li, J., Zeng, X. ,2023] (Validation workshop 2026).
Demand
Global niobium market demand is estimated to be around 117 000 tonnes in 2025, and is estimated to increase close to 190 000 tonnes by 2030 [Mordor Intelligence,2024b].
EU's demand for niobium is mainly in the form of ferro-niobium. The demand for ferro-niobium in the EU is driven by the use of steel in construction, infrastructure and automotive applications, and especially by the increased use of HSLA steels [MSP-REFRAM,2021].
The EU consumption of niobium is evaluated at processing stage. At processing stage the EU consumption of niobium is presented by CN 72029300 (Ferro-niobium) and 81129240 (Unwrought niobium 'columbium'; niobium 'columbium' powders). Import and export data is extracted from Eurostat Comext (2025). Production data is extracted from BGS (2025).
The apparent EU consumption of niobium at processing stage is presented in Figure 10. At processing stage, the average apparent EU demand between 2020 and 2024 was 13 ktonnes.
The import reliance of EU was 100% for the processing stage.
Main use of niobium is as an additive in high strength low alloy (HSLA) steel, stainless steel and other special steels, which are used in various sectors including construction, automotive and other transport (car and truck bodies, ship hulls, railroad tracks), oil and gas pipelines, and tool steels [T.I.C.,2025]. In addition, niobium materials are used in superalloys [T.I.C.,2025b], superconductors for MRI, and other applications.
Figure 11 presents the shares of global end use sectors of niobium in 2024, and Figure 12 presents the shares of the end uses of niobium in the EU in 2024. [Beta Technology,2025]
The update of the MSA study reports following use shares for niobium in the EU: about 44% of niobium is used in construction, 17% in the production of steel for automotive sector, 16% for oil and gas, 9% for stainless steel, 2% for other special steels, and rest, 12%, is for other uses [European Commission,2024].
The calculation of economic importance is based on the use of the NACE 2-digit codes and the value added at factor cost for the identified sectors. The value-added data corresponds to 2023 figures, unless indicated otherwise (Table 5). Figure 13 presents value added per 2-digit NACE sector over time.
| Applications | 2-digit NACE sector | Value added of NACE 2 sector | 4-digit CPA |
|---|---|---|---|
| Construction (Steel) | C25 - Manufacture of fabricated metal products, except machinery and equipment | 220,000M€ | C25 - Manufacture of fabricated metal products, except machinery and equipment |
| Automotive (Steel) | C29 - Manufacture of motor vehicles, trailers and semi-trailers | 240,806M€ | C29 - Manufacture of motor vehicles, trailers and semi-trailers |
| Stainless Steel | C24 - Manufacture of basic metals | 74,046M€ | C24 - Manufacture of basic metals |
| Superalloys | C30 - Manufacture of other transport equipment | 75,800M€ | C30 - Manufacture of other transport equipment |
| Oil & Gas | C24 - Manufacture of basic metals | 74,046M€ | C24 - Manufacture of basic metals |
| Others | C27 - Manufacture of electrical equipment | 125,000M€ | C27 - Manufacture of electrical equipment |
Globally, about 90% of niobium is used in the production of high-strength low-alloy (HSLA) steels [T.I.C.,2018d]. Niobium is an important microalloying element in steel. It increases strength in multiple ways (grain refinement, precipitation hardening, transformation strengthening), stabilises free interstitials in ultra-low carbon steels, and controls the microstructural evolution during annealing treatments. By its multiple metallurgical effects, niobium allows the achievement of combinations of strength and toughness which are highly beneficial for weight reduction and operational performance. Typically, very low share of niobium is used as an additive, e.g. in HSLA steel niobium is often less than 0.1% of the total alloy, and such steels are thus also called micro-alloyed steels [T.I.C.,2018d].
Niobium micro-alloyed HSLA steels are used in construction as beams, sections and plates or composite structures such as rebars in reinforced concrete structures [Niobium,2024]. Their properties (strength, durability, and cost-effectiveness) make them suitable for building bridges, high-rise buildings, and other critical infrastructure projects [Mordor Intelligence,2024b].
The automotive and shipbuilding segment is estimated to be among the fastest-growing use sectors for niobium, projected to grow at approximately 15% during 2024-2029 [Mordor Intelligence,2024b]. The growth is especially driven by the increasing demand for lightweight and fuel-efficient vehicles. Today about 80% of all automotive steel grades are HSLA micro-alloyed with niobium [T.I.C.,2018d].
Niobium-alloyed stainless steels are used e.g. in various automotive parts including exhaust systems, fuel tanks of hybrid vehicles, decorative trims of automotive doors and windows and some fuel cell bipolar plates. Niobium in stainless steel parts enhances performance leading to reduced emissions and extended component lifetimes [Niobium,2024b].
Steels which contain significant quantities of niobium are typically used in high-performance industries, or specialised applications where traits such as excellent corrosion and oxidation resistance and high strength at high operating temperatures are sought. These type of superalloys are used in aerospace and energy industry such as in turbine blade applications (jet engines, land based turbines) and in the nuclear power (e.g. reactor parts) [T.I.C.,2025].
Most of the high-pressure gas and oil pipelines globally are niobium containing HSLA which are able transport large volumes of hydrocarbons at higher pressures. Typical steel grade in this application is X70 containing 0.03% niobium [T.I.C.,2018d]. The advantages of using niobium containing steels in pipelines are improved safety, optimum mechanical properties, cost reduction, lower environmental impact and GWP potential [Niobium,2023].
Niobium-based chemicals have unique optical, piezoelectric (i.e., the ability to generate an electric charge in response to mechanical stress) and pyroelectric (i.e., the ability to generate an electric charge in response to heating or cooling) properties that are sought after in several high-technology applications. For example, compounds such as lithium niobate are used in the production of capacitors and surface acoustic wave filters, which are used in the manufacture of mobile phones and other touch screen devices. [T.I.C.,2025].
High-purity niobium oxide is used in the production of high-refractive index glass used in the manufacture of camera lenses. [T.I.C.,2025].
Other uses of Nb in industrial applications include production of niobium carbide. Niobium carbides are extremely hard ceramic substances which are produced by sintering niobium powder with carbon at high temperature. They are resistant to wear and high-temperature and are used to produce hard cutting tools (e.g. industrial high-speed cutting tools) and refractory coatings that are used in nuclear reactors and industrial furnaces [BGS,2011].
| Use | Percentage | Substitute | Sub share | Cost | Performance |
|---|---|---|---|---|---|
| Construction (Steel) | 31% | No substitute | 70% | No substitute | |
| Construction (Steel) | 31% | Molybdenum | 10% | Similar or lower costs | Reduced |
| Construction (Steel) | 31% | Titanium | 10% | Similar or lower costs | Reduced |
| Construction (Steel) | 31% | Vanadium | 10% | Similar or lower costs | Reduced |
| Automotive (Steel) | 21% | No substitute | 70% | No substitute | |
| Automotive (Steel) | 21% | Titanium | 10% | Similar or lower costs | Reduced |
| Automotive (Steel) | 21% | Molybdenum | 10% | Similar or lower costs | Reduced |
| Automotive (Steel) | 21% | Vanadium | 10% | Similar or lower costs | Reduced |
| Stainless Steel | 17% | Titanium | 50% | Similar or lower costs | Reduced |
| Stainless Steel | 17% | Molybdenum | 50% | Similar or lower costs | Reduced |
| Superalloys | 13% | not assessed under 10% | 100% | No substitute | |
| Oil & Gas | 8% | No substitute | 70% | No substitute | |
| Oil & Gas | 8% | Titanium | 10% | Similar or lower costs | Reduced |
| Oil & Gas | 8% | Molybdenum | 10% | Similar or lower costs | Reduced |
| Oil & Gas | 8% | Vanadium | 10% | Similar or lower costs | Reduced |
Possible substitutes of niobium for different uses are presented in Table 6.
Currently, there appears to be little economic or technical incentive to substitute niobium in its principal applications. In theory, partial or full substitution of niobium by other minerals is possible depending on the technical, economic, and environmental requirements of each application. These include molybdenum, titanium, and vanadium as alloying elements in high-strength low-alloy steels, tantalum, and titanium as alloying elements in stainless and high-strength steels, and ceramic matrix composites, molybdenum, tantalum, and tungsten in high-temperature (superalloy) applications [USGS,2025] [MSP-REFRAM,2021].
However, any substitution would be associated with reduced performance and could involve the use of other raw materials assessed as critical. Alloy properties are not controlled by a single metal, but by several metals, and each metal may produce a range of effects in the alloy. For example, in the production of HSLA steel, niobium is used in combination with small amounts of other metals, including (but not limited to) chromium, nickel, copper, vanadium, molybdenum, titanium, calcium, rare earth elements and zirconium. The interaction between these additions is complex, but they can be used to modify properties such as strength, toughness, corrosion resistance and formability [Beta Technology,2016]. Therefore, assuming 1:1 substitution in alloys is overly simplistic and it cannot be reasonably assumed that the increased addition of one of these metals in the absence of niobium would produce a steel with the same properties.
In practice, the substitution is dependent on the end use application and the required properties. In the case of steel, the final properties depend on the combined effects of alloy composition, processing route and microstructure development, and therefore the feasibility of substitution must be assessed on a case-by-case basis. The complexity of the substitution is reflected in the modest substitution shares presented in Table 6 for all considered applications.
Niobium-containing HSLA steels are widely used in buildings, bridges and other infrastructure applications. In some cases, substitution of niobium by e.g. vanadium, molybdenum or titanium is technically possible.
Niobium-containing HSLA and advanced high-strength steels are used to reduce vehicle weight while maintaining strength and safety performance in the automotive sector. Similar to construction, other microalloying strategies, including the use of vanadium, molybdenum or titanium, may be used in some cases depending on the steel grade, manufacturing process and required end use properties.
The feasibility of substitution of niobium in stainless steel depends on the stainless steel grade, and required properties for the end use application. Titanium and tantalum are potential substitutes in some cases.
USGS identifies ceramic matrix composites, molybdenum, tantalum and tungsten as potential substitutes for niobium in high-temperature superalloy applications [USGS,2025].
Not assessed
Supply
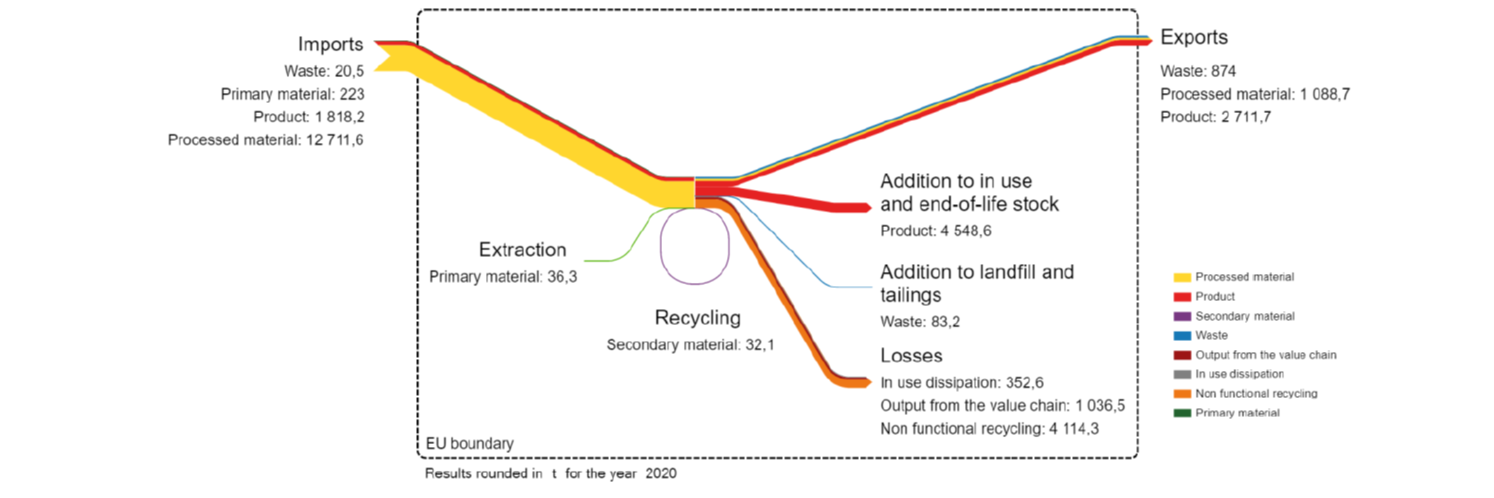
The latest Material System Analysis for niobium at the EU level was for the year 2020.
Niobium ores and concentrates are not mined in the EU. There was a small extraction of niobium in form of a niobium-tantalum concentrate from tailings in Spain (30 t) from 2018 until 2021 [European Commission,2024]. Additionally, 220 tonnes of niobium in ores and concentrates was imported to the EU in 2020. This was supported with about 30 t Nb from manufacturing waste generated in the EU, and 6 t Nb from post-consumer functional recycling of special steel in the EU. Most of niobium supplied to the EU is imported as processed materials such as ferroniobium, niobium metal or chemicals [European Commission,2024].
According to the RMIS, there has been production of 1,200-2,400 tonnes of ferroniobium/year in the EU for 2012-2021 [RMIS,2024d]. In addition, specialist niobium-based alloys (e.g. superalloys) and chemicals (e.g. lithium niobate) are manufactured in Europe, although it is difficult to quantify how much [BIO Intelligence Service,2015] [Beta Technology,2016]. NPM Silmet (Estonia) is a European refiner of niobium producing highly pure niobium. Buss & Buss Spezialmetalle (Germany) recycles niobium scrap [Buss & Buss Spezialmetalle,-].
There are over 90 types of niobium-containing minerals but only two minerals are economically viable to extract: pyrochlores, presenting a maximum of 71% of Nb2O5 and columbite-tantalite, presenting 76% as a maximum level of Nb2O5 [Henrique do Nascimento Pereira, P., Marques Cury, C., Anastacio de Campos, A., Roger Pointer Malpass, G., Roberto Alves, E. ,2022]. Three major mines (Araxa and Catalao/Bona Vista deposits in Brazil, and Niobec deposit in Canada) extract niobium from pyrochlore minerals, whereas columbite deposits occur in Brazil, Nigeria, and other countries in central Africa where niobium is typically extracted together with tantalum [T.I.C.,2025d].
Niobium deposits are most commonly associated with peralkaline granites or syenites, and/or carbonatites (i.e. an igneous rock that consists of more than 50% primary carbonate minerals). Secondary deposits of niobium, such as laterites, and residual placers, typically form by the weathering of igneous deposits (Dill, 2010).
Carbonatite-hosted niobium deposits can be divided into primary and secondary deposit types. Primary deposits are generally in the tens of millions of tonnes size range and typically have ore grades of less than 1 wt. % Nb2O5. Carbonatites are found in areas of crustal extension or rifting and are thought to be derived from direct melting of the mantle. They are enriched in High Field Strength Elements (HFSE) (e.g. niobium, zirconium and rare earth elements), but also barium, strontium, thorium and uranium. Important ore minerals in these rocks include perovskite and pyrochlore, and niobium-rich silicates such as titanite [BGS,2011]. Secondary niobium deposits are associated with deep, tropical weathering of carbonatites and are typically very large (up to 1 000 Mt) and have very high ore grades (up to 3 wt. % Nb2O5 in lateritic deposits, but as high as 12 wt. % Nb2O5 in some residual placers). Pyrochlore is the most common ore mineral in these secondary ore deposits [BGS,2011].
Niobium deposits associated with peralkaline granites and syenites are typically less than 100 Mt in size [BGS,2011] and have ore grades of between 0.1 and 1 wt. % Nb2O5, contained in ore minerals such as columbite, eudialyte and loparite. Alkaline magmas responsible for the formation of these deposits are derived by melting of enriched sub-continental lithospheric mantle and are typically enriched in the HFSE (i.e. niobium, zirconium and rare earth elements). These incompatible (i.e. elements that become concentrated in molten magma rather than early crystallising solid minerals) HFSE are further upgraded by magmatic (e.g. fractional crystallisation) and/or hydrothermal processes [BGS,2011].
| Country | Resources (tonnes) |
|---|---|
| no data |
Global resources of niobium are about 84 Mtonnes, but occur almost exclusively in Brazil, which currently accounts for about 96% of all global resources [Linnen, R., Trueman, D.L. and Burt, R.,2014]. Most of the world’s identified resources of niobium occur as pyrochlore in carbonatite (igneous rocks that contain more than 50%-by-volume carbonate minerals) deposits. World resources of niobium are more than adequate to supply global projected needs [USGS,2025].
There are no estimates on the amount of Nb resources in Burundi, China, Ethiopia, Nigeria, Russia, Rwanda, and Uganda.
| Country | Nb Reserves (in tonnes) |
|---|---|
|
Brazil |
16,000,000 |
| Canada | 1,600,000 |
| United States | 210,000 |
| World total | > 17,000,000 |
Known global reserves of niobium (as Nb) are estimated to be more than 17,000 ktonnes (Table 8), mainly in Brazil and Canada. In addition, niobium is concentrated within certain igneous and sedimentary deposits in U.S. These resources occur in nine states, while resources are estimated at 1,400 kt. Only 210 ktonnes of U.S. resources were estimated to be economically mineable.
| Country | Quantity (Mt of Nb2O5) | Location |
|---|---|---|
| Austria | No information | Occurrences associated with granitic pegmatites, which contain niobium |
| Czech Republic |
No information | Occurrences mainly related to granitic pegmatites that contain Nb and Ta minerals |
| Finland | 250 Mt of ore at 0.21 % Nb |
Sokli P-Fe-Nb deposit |
| 8.15 Mt of ore with Nb oxide contents ranging from 0.12 % to 0.76 % and a calculated total amount of 13 000 t Nb2O5 | Jokikangas, Katajakangas and Kontioaho | |
| France |
1 860 t of Nb2O5 |
Tréguennec deposit |
| No information |
There are other Nb and Ta-bearing mineral occurrences in France, which are mostly in granitic pegmatites |
|
| Germany | No information | Deposits and occurrences hosted by granitic and alkaline rocks |
| Italia | No information | There are over ten Nb-Ta occurrences in Italy that are hosted by granitic pegmatites. |
| Malta | No information | One sedimentary phosphorite occurrence |
| Netherlands | No information | Two sedimentary phosphorite occurrence |
| Portugal | 350 t Nb2O5 | Almendra deposit |
| Slovakia | No information | Four deposits with both niobium and tantalum as the main commodities, which are hosted by granitic pegmatites. |
Primary niobium resources in Europe have been identified and quantified in SCRREEN2 [Lauri et al.,2018]. Data concerning the most significant niobium resources in the EU are presented in Table 9.
| Country | Classification | Quantity (Mt of ore) | Grade (% Niobium) | Reporting code | Reporting date | Source | ||
|---|---|---|---|---|---|---|---|---|
| no data |
Figure 15 presents the global production of niobium (in terms of niobium content) since 1984 according to WMD. Brazil is the major producer, representing 92% of the global production in 2024, while Canada produced 6%, and Rest of the World 2% of the total mine production World Mining Data,since 1984]. With the exception of the African countries reporting minor production [World Mining Data,since 1984], companies extracting niobium ores are typically integrated, meaning they also produce processed niobium products, such as niobium oxide, ferroniobium and niobium metal [T.I.C.,2025d].
Figure 16 present the global mine production of niobium in tonnes since 2009 according to USGS. The overall trend and shares of producing countries are similar to WMD data (Figure 15), although somewhat higher numbers are reported by USGS.
There is no mine production of niobium in the EU.
In addition to primary extraction, niobium can be extracted as by-product of tin smelter waste, extracted from sludge from the cemented carbide tool industry, or from mill scrap from alloyed and unalloyed metal fabrication, and scrap from industrial alloys and superalloys. [MSP_REFRAM,2021]
According to the United Nations Environment Programme (UNEP) the End of Life (EoL) recycling input rate for niobium, chiefly as a constituent of ferrous (e.g. steel) scrap, is greater than 50% [Reuter, M. et al,2013]. However, the amount of niobium physically recovered from scrap (i.e. functional recycling) is negligible, with estimates by BIO Intelligence Service [EU MSA 2015 Report,2015] given at less than 1%, i.e. 0.3% (Validation workshop 2019).
Volume-wise the most potential sources for niobium recovery are steels due to the major share of use, but the niobium content is low (<0.5% in weight). Other potential sources with higher niobium content include nickel-based superalloys, used in jet engines, which may contain around 5% niobium by weight, superconducting wires used in the magnets of MRI scanners, high energy physics and fusion research contain typically 30-50% niobium depending on the specific composition. In addition, next generation lithium-ion battery materials may contain 15-20% niobium which could become a significant use for niobium in the next 10 years, however, there is high uncertainty of the market development. [Circular Niobium,2024]
Tin slags represent a relatively well geographically scattered secondary source of tantalum and niobium [Allain, E., Kanari, N., Diot, F., Yvon, J.,2019]. Certain other countries like China, Argentina, Congo D. R., Spain, Saudi Arabia, US, Malaysia, Rwanda, Gabon, Uganda, Ethiopia, Namibia, Thailand, Venezuela, Zimbabwe, Mozambique and South Africa have lesser deposits [Lewicka, E., Guzik K., Galos, K.,2021]. For instance, NioCorp Developments Ltd. and GX Acquisition Corp II have announced the signing of a proposed business combination between the two companies, to acquire funds for high-grade niobium mining in Nebraska (U.S. Geological Survey 2020). Prospective reserves of niobium (Nb2O5) in Bayan Obo (China) are 6.6 million tons, ranking second in the world [Zhang, B., Xue, X., Yang, H.,2022].
| MSA Flow | Value (tonnes) |
|---|---|
|
B.1.1 Production of primary material as main product in EU sent to processing in EU |
0 |
| B.1.2 Production of primary material as by-product in EU sent to processing in EU | 30 |
| C.1.2 Imports to EU of primary material | 223 |
| C.1.3 Imports to EU of secondary material | |
| D.1.3 Imports to EU of processed material | 12710 |
| E.1.6 Products at end of life in the EU collected for treatment | 4740 |
| F.1.1 Exports from EU of manufactured products at end-of-live | |
| F.1.2 Imports to EU of manufactured products at end-of-live | |
| G.1.2 production of secondary material from post-consumer functional recycling in EU sent to processing in EU | 6 |
| G.1.1 production of secondary material from post-consumer functional recycling in EU sent to manufacture in EU |
According to a recent MSA of niobium in the EU, niobium contained in the waste is mostly non-functionally recycled. There is very little post-consumer functional recycling of niobium (6 t in 2020), and most ends up in slags during recycling of steel, which again is mostly used for construction of roadways, or diluted down, not valued for its functions (4,110 t Nb total). [European Commission,2024]
The collection rate of niobium at end-of-life was 87% in 2020, and the end-of-life recycling rate (EoL-RR) was <1%. As a result, the end-of-life recycling input rate, EoL-RIR was calculated to be <1%. The differences between collection on the one hand and EoL-RR and EoL-RIR on the other hand result from the fact that nearly all applications apart from special steel are not recycled for their niobium content and niobium is going into slag. [European Commission,2024]
For specific applications, higher recycling rates may be achieved. In particular, superalloys with high niobium content (e.g. EN steel number 2.4868 with up to 5.5% Nb), recycling rates of up to 70% have been reported. However, only a small fraction (approximately 4%) of niobium is used for superalloys and lower recycling rates are reported for the total niobium market; 50% in the year 1998 and 56% more recently. For instance, the Scholz company, a large scrap dealer processing 1.4 Mt steel scrap annually, has indicated that only alloying elements higher than 1% are evaluated for recycling; this implies that niobium is not considered at all [Tkaczyk, A.H., Bartl, A., Amato, A., Lapkovskis, V., Petranikova, M.,2018].
Niobium is also found in end-of-life products such as WEEE and end-of-life vehicles, however, very low content in the final product poses a challenge for the recovery of niobium:
- Waste electric and electronic equipment (WEEE). A computer can contain 0.0002% of niobium. The amount of niobium recovered from collected IT and telecommunications equipment could be as high as 1.2 tonnes, and the grade of niobium in PCB is about 36 g/t.
- End-of-life Vehicles. The amount of niobium in ELV can be estimated based on the grades of niobium used in stainless steels, which is in the range of 0.04-0.08%. [MSP-REFRAM,2021]
It has been estimated for the end-of-life vehicles - in 2010, the total number of ELVs was around 40 million, mainly in Germany, Italy, France, UK, Spain, USA, Canada, Brazil, Japan, China, Korea and Australia – there was a possibility to reduce annual emissions due to niobium exploitation by 18% in years 2010–2050, thanks to the reuse of niobium in secondary production rather than primary one. Globally, the recycling of niobium could save around 133–161 m GJ energy between 2010 and 2050 and reduce emissions by 44–53 mt CO2-eq in the same period, with the highest impact in the USA, EU, China and Japan [Golroudbary, S.R., Krekhovetckii, N., El Wali, M., Kraslawski, A.,2019].
Similar to end-of-life scrap, most of the niobium scrap generated from product manufacturing is not recycled for the value of niobium. A recent MSA for niobium in the EU estimates that niobium from new scrap mostly ends up in slags used for road construction or being diluted in other products (1,020 t Nb), with only 30 t Nb being reprocessed and 80 t Nb considered to be sent to landfill. [European Commission,2024]
Niobium is mainly mined as the primary ore. The main source of niobium is pyrochlore, which is typically processed by physical processing technology to give a concentrate ranging from 55 to about 60% niobium oxide, which is then further processed into ferroniobium and other products such as niobium metal, niobium oxide or carbide [T.I.C.,2025d].
Near-surface niobium deposits are typically exploited by open-pit mining methods, which commonly involve removing overburden, digging or blasting the ore, followed by removal of the ore by truck or conveyor belt for stockpiling prior to processing. About the 85% of globally produced niobium is extracted in Araxá open pit mine in Minas Gerais, Brazil.
Deeply buried niobium deposits are mined underground using conventional mining methods, such as room and pillar, where mining progresses in a horizontal direction by developing numerous stopes, or rooms, leaving pillars of material for roof support. Ore is blasted and then transported by rail, conveyor or dump truck to the processing plant.
Regardless of the mining method employed niobium ores are first crushed in jaw, cone or impact crushers and milled in rod or ball mills operating in closed circuits with vibrating screens and screw classifiers to liberate niobium mineral particles. The slurry containing niobium and waste rock is further concentrated to around 54% niobium oxide using a number of methods in multiple stages: gravity separation, froth flotation, magnetic and electrostatic separation, and acid leaching may be used, depending on the physical and chemical characteristics of the ore [BGS,2011].
Typically, niobium ores from carbonatite-associated deposits are screened, classified, and deslimed (i.e. removal of very fine particles). Carbonate material is removed by froth flotation, followed by an additional desliming stage. Magnetite is removed by low-intensity magnetic separation, and sent to waste. The sought-after pyrochlore is collected by froth flotation. A final stage of froth flotation is used to remove sulphides, such as pyrite. Residual impurities may be leached by hydrochloric acid, leaving a final concentrate that contains about 54% niobium pentoxide [IAMGOLD,2019] [BGS,2011].
Niobium concentrates are further refined by hydrometallurgical processes to produce niobium fluorides, oxides or chlorides. An example of a simplified flowsheet is presented in Figure below. Usually, the acid digestion of ores is applied using a mixture of hydrofluoric acid with other mineral acids, generally sulphuric acid. The key-step of the metallurgical process of niobium concerns its separation from tantalum through fractional crystallization. Separation is conducted at an acid concentration of about 1 to 7% HF, where the solubility of niobium complex is nearly 10 to 12 times that of tantalum. The separation of niobium and tantalum by fractional crystallization is feasible via the formation of double fluoride complexes with potassium. As the solubility of potassium fluorotantalate (K2TaF7) is low, it crystallizes out. The crystalline solid is redissolved and recrystallized. The process is conducted in several stages. The process works quite satisfactorily and relatively easily as far as the preparation of pure tantalum complex K2TaF7 is concerned [MSP-REFRAM,2021]. After its isolation, Nb intermediate compounds are further treated by electrometallurgical (e.g. electrolysis) or pyrometallurgical (e.g. aluminothermic reaction) processes. Ferroniobium, containing 65–66% niobium, is also produced by aluminothermic reaction, but with the addition of iron oxide powder. Niobium carbide is produced by high temperature sintering of niobium oxide powder with carbon [Albrecht, W. W.,1989] [BGS,2011].

Figure Simplified flowsheet diagram of the Nb extractive metallurgy including the leaching of the initial Nb-containing concentrates and the separation of Nb by Ta [MSP-REFRAM,2021].
In addition to primary sources, niobium can be also processed from secondary sources, such as tin slag and metal scrap. General flowchart for the production different niobium products from different sources is presented in Figure below. [Sundqvist Ökvist, L. ,2018]

Figure General flowchart for the niobium processing from primary and secondary resources [Sundqvist Ökvist, L. ,2018]
Other considerations
Niobium has only one naturally occurring stable isotope, 93Nb [CIAAW,-]. Niobium itself is not radioactive in nature, however, pyrochlore, the most important source of niobium, can contain significantly elevated concentrations of uranium and thorium series radionuclides [IAEA,2006]. IAEA notes the need to monitor and control especially residues and wastes generated in the processing of niobium ores and concentrates.
The ILO Encyclopaedia of Occupational Health and Safety (International Labour Organization) addresses the safety and health measures in the mining operations: “During the mining and concentration of niobium ore containing uranium and thorium, the worker should be protected against radioactivity” [ILO,2011b]. Moreover, the ILO specifies that “atmospheric concentrations of the aerosols of niobium alloys and compounds that contain toxic elements such as fluorine, manganese and beryllium, should be strictly controlled”.
According to the classification provided by companies to ECHA in REACH registrations niobium is a flammable solid [ECHA,2022]. This is likely to concern niobium in powder form, particularly in a case of dust accumulation and exposure to ignition. In a flammability test carried out for ferroniobium (following EC method A.10.), the test item was classified as "not highly flammable" [CBMM,2010] . According to one material safety data sheet, niobium metal powder below 5 microns may be pyrophoric, and may be flammable in the form of dust by chemical reaction or when exposed to flame, however, no test results are provided for the statement [Stanford Advanced Materials,2012].
Alves and Coutinho (2019) estimate that Nb mining can generate approximately 40 tonnes of solid waste per tonne of ferroniobium (FeNb) [Alves,2019]. The acid formation potential associated with niobium extraction is low, in a context of extraction from sulphide-free deposits [German Environment Agency,2020].
Da Silva Lima et al. (2022) quantified the environmental impacts of FeNb and niobium oxides (Nb2O5) production through a cradle-to-gate life cycle assessment (LCA), based on data provided by the niobium producer responsible for roughly 75 % of the global market. For 2019, the authors calculate a global warming impact of 5.09 kg CO2 eq./kg FeNb and 4.70 kg CO2 eq./kg Nb2O5. Regarding FeNb production, the supply of aluminium is overall the main source of environmental impacts affecting all the considered impact categories. Regarding high purity Nb2O5 production, processing chemicals show the main contribution, affecting all the considered impact categories. The authors finally calculate that production process improvements in 2019 resulted in significant impact reductions compared to the 2017 levels, thanks to process optimizations “such as less petroleum coke, LPG, niobium oxide processing chemicals and (bio)diesel, but especially due to the use of fully renewable electricity” [da Silva Lima,2022].
CBMM, the main global producer of niobium, has developed an LCA of FeNb based on their 2022 production [CBMM,2024]. This study was audited by a third party, DNV Italy, and published through an Environmental Product Declaration in the EPD International program. Compared to the study by Da Silva Lima et al. (2022), based on 2019 production, there have been significant process changes, resulting in approximately a 70% reduction in the carbon footprint of FeNb. The current total global warming potential is reported as 1.66 kg CO2eq./kg of FeNb. This reduction is mainly due to the adoption of recycled aluminum in the reduction process within the metallurgical route, as well as reduction of fossil fuel consumption, such as LPG and Diesel, and the increased use of biofuels like biodiesel.
Trade restrictions for niobium ores and concentrates are in place in Brazil, Ethiopia, Nigeria, and South Africa (licensing requirement) and in Burundi and Rwanda (fiscal tax on exports) in 2022 [OECD,2024A].
Table 12 lists the countries for which the economic value of exports of ferro-niobium (72029300) represents more than 0.1% of the total value of their exports in 2023 [OECD,2025].
| Country | Export value (USD) | Share in total exports |
|---|---|---|
| Brazil | 2497074583 | 0.70% |
Currently niobium mining in Brazil takes place in two locations, the larger one being in Araxá, Minas Gerais and the smaller in Catalão, Goiás. There are also non-commercial deposits in Amazon, which are estimated to constitute 21 % of Brazil’s niobium reserves [Vasconcelos,2019]. A study considering scenarios for niobium mining in northwest portion of the Brazilian Amazon (Seis Lagos region) estimated that developing the mining sites and required infrastructure would likely cause significant forest loss, and affect biodiversity and fragile ecosystems [Siqueira-Gay,2020]. It should be noted that the current legislation does not allow mining in Seis Lagos area, although there has been political pressure to allow mining activities in the Indigenous lands in the Amazon area [Maisonnave,2020].
• Niobium applications in Li-ion batteries
Niobium (Nb) is being explored in the development of advanced Li-ion batteries made with engineered niobium components with several benefits for the performance of the batteries [Niobium,2024c]. For example, niobium can play a role in new anode materials for batteries particularly in the form of niobium oxides and mixed metal oxides such as titanium–niobium and tungsten–niobium oxides, which are being developed for fast-charging, high-power applications with long cycle life [Sheng Y. et al,2023] [Xie F., et al,2023] [Niobium,2024c]. Niobium can play a role also in new cathodes materials. It is being used as a dopant to develop cobalt-reduced or -free, lithium-rich, and manganese-based Li3NbO4-based new materials for cathodes with higher energy density and longer-term stability [Nunes B., et al,2023]. Moreover, Nb-based coatings can be used as a protective film over the surface of the cathodes, to reduce the degradation of the cathode materials and to enhance its electrochemical performance [Nunes B., et al,2023]. Finally, niobium is being explored in some solid-state battery concepts, particularly in coatings and solid electrolytes, but its role remains under development [Nunes B., et al,2023] [Kosctiuk J. B., et al,2024].
• Nb-based materials for Hydrogen production and conversion
Niobium is studied for hydrogen production and fuel cell technologies, especially to improve catalytic performance and durability [Monteiro R. S.,2020]. In the field of green hydrogen production technologies, niobium has a role in the synthesis of catalytic materials for solar water splitting, where niobium-based photocatalysts such as niobates and Nb2O5 have been studied for hydrogen evolution from water and in PEM-based water electrolysis, where Nb-containing materials are investigated in catalysts and components to improve durability and reduce the use of other critical raw materials (platinum group metals, PGMs) [Nunes B., et al,2020] [Monteiro R. S.,2020]. In the field of hydrogen conversion into other forms of energy, the development of niobium-containing materials is being investigated for applications as electroactive catalytic and support materials in PEM fuel cells [Hadley A. M. K. et al,2024]. In all these applications, the use of niobium allows several advantages: reduced reliance on PGMs and, in some cases, replacement of carbon-based support, higher resistance to corrosion in acidic media, PGM higher dispersion and better use of active sites, PGM sintering resistance, PEM Fuel Cells and PEM-water electrolysis at low overpotentials [Monteiro R. S.,2020].
• Niobium-based materials for supercapacitors
Niobium-based materials, particularly Nb2O5 and related composites, are being investigated as electrode materials for supercapacitors due to their rapid ion diffusion, good chemical stability, and pseudocapacitive charge storage behaviour, enabling high power density and long cycle life. Recent research focuses on nanostructuring and composite design (e.g. with carbon or other conductive materials) to address the intrinsically low electrical conductivity of niobium oxides and improve overall electrochemical performance. [Yang G. et al,2021] [Worku Y. S. et al,2025]
Niobium is a potential material in superconducting quantum technologies, where it is used in Josephson junctions that form the core components of qubits due to its favourable superconducting properties [Argonne National Laboratory,2024] [Nikalyte,-]. Recent research indicates renewed interest in niobium-based qubits and components, with studies showing that niobium can achieve performance comparable to state-of-the-art system [Argonne National Laboratory,2024] . However, the potential impact on niobium demand remains uncertain.