Overview
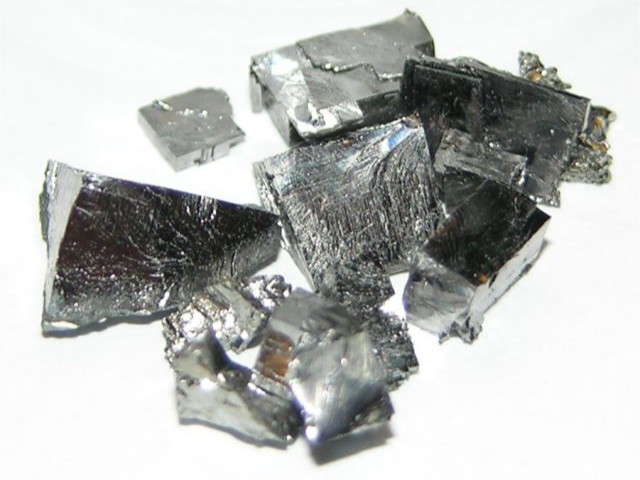
Tantalum (chemical symbol Ta) is a silvery-grey hard, transition metal. It has a high density (16.6 g/cm3) and the fourth highest melting point (3,020°C). It is highly resistant to corrosion and has a great permittivity. Tantalum's estimated abundance in the upper continental crust is 0.9 ppm [Rudnick, R. L. and Gao, S.,2014], which is quite rare. It is not found as a free metal in nature but occurs notably in the minerals microlite and tantalite-columbite. Most tantalum is produced as a co-product as it occurs in complex mineral form, often associated in ore bodies with niobium, tin or lithium.
| Global production | Global producers | EU consumption | EU share | EU suppliers | Import reliance |
|---|---|---|---|---|---|
| 1,770t | Congo, D.R. 38% Rwanda 17% Brazil 16% Nigeria 7% China 6% Ethiopia 5% Mozambique 4% Australia 3% | 16t | 1% | Spain 80% France 20% | 0% |
| Global production | Global producers | EU consumption | EU share | EU suppliers | Import reliance |
|---|---|---|---|---|---|
| 0t | 91t | 0% | United States 27% Japan 14% Thailand 13% China 11% Korea, South 6% Kazakhstan 5% United Kingdom 4% Hong Kong 4% Switzerland 3% Russia 2% | 100% |
Tantalum is not traded on any metals exchange, and there are no terminal or futures markets where buyers and sellers can fix an official price. Since tantalum is a small industry, it has been susceptible to rapid price changes in the past.The average price of tantalum for 2020-2024 was 153 €/ kg of Ta2O5 content, maximum being 179 €/ kg of Ta2O5 content (2022) and minimum 131 €/ kg of Ta2O5 content (2021).
Tantalum is usually co-produced with niobium. It is also commonly associated with tin and lithium ores and can be extracted as by-product. About 50-80 % of tantalum world production comes from primary production, 10-30% from scrap recycling and 10-20% from Sn slags [Matos et al.,2021]. Major part of the global primary supply in recent years comes from artisanal and small scale mining from the Great Lakes Region of Central Africa.
According to the WMD, global mine production of tantalum between 2010 and 2024 ranged from 655 t (2010) and 2,280 t (2024).Main producing countries of tantalum are Democratic Republic of Congo, Rwanda, Brazil, Ethiopia, and Nigeria, with shares of 41%, 20%, 14%, 8%, and 7% of the total production, respectively. Until 2008 Australia was the most important supplier of tantalum, but its production decreased significantly and now accounts only minor share in global production. The highest rise in tantalum production during the last decade is observed for Democratic Republic of Congo.
Tantalum can be recovered from scrap, incineration bottom ash, superalloys, pyrometallurgical slag, and tin slag. Majority of recycling can be considered as ‘pre-consumer’ that is from within the upstream supply chain itself, rather than from end-of-life products.
According to [Matos et al.,2021], EU tantalum processing sector used 164 t of imported secondary raw material and 2 t of imported waste for the tantalum production in 2016. Secondary tantalum from domestic scrap (old scrap, new scrap from fabrication of semi-finished products as well as new scrap from manufacturing of finished products, referring to “functional recycling”) is also an important input (193 t tantalum content –108t of new scrap and 85 t of old scrap) to produce tantalum processed materials.
The collection rate for tantalum products in EU is estimated at 45% in 2016. However, only 15% end of life products were collected and sorted for functional recycling in the EU (85 t). According to [Matos et al.,2021], end-of-life recycling input rate (EOL-RIR) in 2016 for tantalum in EU results in 13%.
Tantalum is mainly used in electronics sector in Ta capacitors, aerospace applications containing Ta superalloys, sputtering targets, cutting tools, mill products, metallurgical applications, optical applications, biomedical applications and other miscellaneous applications.
| Use | Percentage | Substitute | Sub share | Cost | Performance |
|---|---|---|---|---|---|
| Capacitors | 35.5% | no substitute | 100% | No substitute | |
| Superalloys | 24% | no substitute | 85% | No substitute | |
| Superalloys | 24% | Mo | 5% | Similar or lower costs | Reduced |
| Superalloys | 24% | V | 5% | Similar or lower costs | Reduced |
| Superalloys | 24% | Re | 1% | Similar or lower costs | Reduced |
| Superalloys | 24% | Nb | 1% | Similar or lower costs | Reduced |
| Superalloys | 24% | Ir | 1% | Very high costs (more than 2 times) | Reduced |
| Superalloys | 24% | W | 1% | Similar or lower costs | Reduced |
| Superalloys | 24% | Hf | 1% | Slightly higher costs (up to 2 times) | Reduced |
| Mill products | 12% | no substitute | 100% | No substitute | |
| Sputtering targets | 11% | no substitute | 100% | No substitute | |
| Carbides | 9% | Ti | 33% | Similar or lower costs | Similar |
| Carbides | 9% | Nb | 33% | Similar or lower costs | Similar |
| Carbides | 9% | W | 33% | Similar or lower costs | Similar |
| Chemicals | 8% | Zr | 33% | Similar or lower costs | Reduced |
| Chemicals | 8% | Pt | 33% | Very high costs (more than 2 times) | Reduced |
| Chemicals | 8% | Ti | 33% | Similar or lower costs | Reduced |
Substitutes of tantalum for different applications remain the same as in the years 2010-2020. No major change has been identified. Although a range of substituting elements are theoretically available, practical substitution of tantalum is often constrained by design requirements, long certification cycles in critical applications, and the fact that several substitutes are themselves supply?constrained or critical.
Tantalum demand is expected to continue increasing, driven primarily by its use in electronic components. A significant share of global tantalum supply originates from African countries, with artisanal and small-scale mining continuing to play an important role in production. In addition to primary production, recovery of tantalum as a by-product of lithium mining may provide additional supply in the future, particularly in Australia, Brazil and Mozambique, although its contribution depends on the site and ore grade characteristics.
Tantalum is one of the “conflict minerals” covered by Regulation (EU) 2017/821, which establishes due diligence requirements for EU importers of tin, tantalum, tungsten, and gold.
Trade restrictions for tantalum ores and concentrates are in place in China, Ethiopia and Nigeria (licensing requirement) and in Burundi, DRC and Rwanda (fiscal tax on exports) in 2022 [OECD,2024A].
Market analysis, trade and prices
| Global production | Global producers | EU consumption | EU share | EU suppliers | Import reliance |
|---|---|---|---|---|---|
| 1,770t | Congo, D.R. 38% Rwanda 17% Brazil 16% Nigeria 7% China 6% Ethiopia 5% Mozambique 4% Australia 3% | 16t | 1% | Spain 80% France 20% | 0% |
| Global production | Global producers | EU consumption | EU share | EU suppliers | Import reliance |
|---|---|---|---|---|---|
| 0t | 91t | 0% | United States 27% Japan 14% Thailand 13% China 11% Korea, South 6% Kazakhstan 5% United Kingdom 4% Hong Kong 4% Switzerland 3% Russia 2% | 100% |
Warning : Table 4 must not be considered as regards EU figures. The only CN Code at the extraction level is 26159000 - Niobium, tantalum or vanadium ores and concentrates. Numbers displayed in Table 4 currently are not specific to tantalum and a conversion factor was used.
Table 4 presents the global production of tantalum at the extraction stage. The global production was 1,584 tonnes in total, and the largest producers of tantalum at the extraction stage were Congo D.R., Brazil, and Rwanda, with shares of 35%, 18%, and 16%, respectively.
France produces a few tons of mixed Nb/Ta concentrate, sent to Brazil for processing. the ration Nb/Ta is unknown.
The main primary source of tantalum is minerals such as tantalite-columbite, microlite, wodginite, struverite, and cassiterite hosted in igneous rocks (e.g. pegmatites, granites, carbonatites). Most tantalum is produced as a co-product as it occurs in complex mineral forms, often associated in ore bodies with niobium, tin or lithium [Matos et al.,2021]. Tantalum can also be extracted as a by-product of tin smelter waste (tin slags), converted to a synthetic concentrate of a tantalum content suitable for standard chemical processing. Such source can be responsible for 20% to 50% of total Ta production, depending on available supply and prices [Matos et al.,2021]. The third source of tantalum is recovery from secondary sources, such as new scrap from manufacturing of Ta powders and ingots as well as manufacturing of Ta containing products (and, end-of-life scrap, although the quantity is not significant) [Matos et al.,2021]. Key companies producing tantalum at extraction stage include Mineração Taboca, AMG Brazil, Yichun Tantalum, Talison Lithium, Lovozerskaja GOK [Raw Material Outlook,2021].
At processing stage, there is no official source for international statistics, and the distribution of producers is quite opaque. Global production is estimated of the order of 1,500 t annually.
In the tantalum industry distinction is often made between "primary processors" and "secondary processors” [T.I.C.,2021]. Primary processors are equivalent of smelters, with the capability to process tantalum mineral concentrates or slags, also secondary concentrates, synthetic concentrates, and scrap. Secondary processors handle tantalum intermediates and process them into final products. The inputs and outputs from these processors are different. The first one can produce anything from K-salt (K2TaF7) to high purity oxides or capacitor-grade tantalum metal powder, while the secondary processor may buy salt, metallurgical grade tantalum metal or tantalum ingot and process them into oxides, capacitor grade powder, or metal products [T.I.C.,2021].
| Mining | Processing/refining | ||
|---|---|---|---|
| CN Code | Title | CN Code | Title |
| 0-26159000 | Unknown | 810320 | Tantalum; unwrought, including bars and rods obtained simply by sintering, powders |
| 810330 | Tantalum; waste and scrap | ||
For the purpose of this assessment, tantalum is evaluated at processing stage. Relevant Eurostat CN trade codes are presented in Table 6. These include CN 810320 - Tantalum; unwrought, including bars and rods obtained simply by sintering, powders (100%), and CN 810330 - Tantalum; waste and scrap (95%). In the absence of a suitable method to disaggregate the share of each element in the annual statistics for CN code 26159000 - Niobium, tantalum, or vanadium ores and concentrates, tantalum is not evaluated at extraction stage.
Figure 5 presents EU trade flows of tantalum in waste and scrap (CN 810330) from 2010 to 2024. Since 2018, the EU imports of tantalum have exceeded exports. In 2020-2024, the imports have fluctuated between 54 tonnes and 88 tonnes, whereas exports have been between 6 tonnes and 42 tonnes.
Figure 6 presents the EU imports of tantalum in waste and scrap by country for the period 2000-2024. In 2024, the exports were 10 tonnes in total, whereas imports were 54 tonnes in total. The main suppliers of the EU of tantalum waste and scrap in 2024 were South Korea, Rest of the World, United States, and United Kingdom, with 45%, 29%, 20%, and 6% of the total supply, respectively.
Figure 7 presents EU trade flows of tantalum, unwrought, including bars and rods obtained simply by sintering, powders (CN 810330) from 2010 to 2024. Since 2017, the EU imports of tantalum have exceeded exports, except in 2021. In 2020-2024, the imports have fluctuated between 33 tonnes and 245 tonnes, whereas exports have been between 6 tonnes and 128 tonnes.
Figure 8 presents the EU imports of tantalum, unwrought, including bars and rods obtained simply by sintering, powders (CN 810330) by country for the period 2000-2024. In 2024, the exports were 6 tonnes in total, whereas imports were 33 tonnes in total. The main suppliers of the EU of tantalum waste and scrap in 2024 were China, Japan, United States, and Rest of the World, with 43%, 25%, 23%, and 9% of the total supply, respectively.
Tantalum is not traded on any metals exchange, and there are no terminal or futures markets where buyers and sellers can fix an official price. References for prices are obtained through averages of past deals between private parties, generally available through paid subscription, such as Asian Metal, and Metal Pages [EC,2020]. Since tantalum is a small industry, it has been susceptible to rapid price changes in the past [Globe Metals and Mining,-].
Figure 9 presents annual average price of tantalum (in kg of Ta2O5 content). The average price for 2020-2024 was 153 €/ kg of Ta2O5 content, maximum being 179 €/ kg of Ta2O5 content (2022) and minimum 131 €/ kg of Ta2O5 content (2021).
During the COVID-19 pandemic, the demand in electronics was in slow acceleration due to chip production supply bottleneck. The demand in electronics, thus tantalum, however, can still be expected to increase. Currently, the total supply of tantalum from African countries accounted around 70% [World Mining Data,2024]. Large share of the tantalum mines is artisanal and small-scale operations, known to be high-grade and easy to mine [T.I.C.,2020].
Tantalum recovery from lithium mining is a potential secondary supply route, however, this potential is site- and ore grade-dependent and does not scale directly with lithium production volumes. While growing demand for lithium is expected to increase the number of lithium mining projects, and could lead to increasing supply of tantalum, this does not necessarily translate into proportional increases in tantalum supply. Currently, tantalum is produced as a by-product of lithium in Western Australia by Global Advanced Metals [Global Advanced Metals,2024], but tantalum supply driven by lithium mining is also expected to increase in Brazil and Mozambique [Stratton, P., Matheson, A.,2021].
Demand
Global demand of tantalum is expected to grow from an estimated 2.6 ktonnes in 2025 to 3.4 ktonnes in 2030 [Mordor Intelligence,2024]. The growth is driven especially by the demand from the electronics sector and manufacturing of capacitors and semiconductors. China is major consumer of tantalum globally due to their electronics industry [Mordor Intelligence,2024] [Andarada Mining,2024]. Most of the consumed tantalum in China originated from imported concentrates, and were used by the electronics sector for tantalum capacitors and semiconductors (67-76 % of total use), followed by cutting tools and use in other sectors [Gao, Z., Geng, Y., Gao,. Z., Liang, Z., Wei, W.,2024].
The EU consumption of tantalum is evaluated at production stage. For tantalum extraction stage, the EU consumption is presented by HS code CN 26159000 (niobium, tantalum or vanadium ores and concentrates), which is not considered reliable and is therefore not analyzed.
For tantalum processing stage, the EU consumption is presented by HS code CN 810320 (Tantalum; unwrought, including bars and rods obtained simply by sintering, powders), and CN 810330 (Tantalum; waste and scrap). Import and export data is extracted from Eurostat Comext.
The apparent EU consumption of tantalum at processing stage is presented in Figure 11. There was no production of tantalum at processing stage in the EU captured by the existing trade codes. It should be noted, however, that secondary processing and refining activities exist within the EU, thus apparent consumption based on the trade codes does not fully capture internal tantalum flows within EU (Validation workshop). The average EU consumption at processing stage was 90 tonnes during 2020-2024.
Tantalum is mainly used in electronics sector in Ta capacitors, aerospace applications containing Ta superalloys, sputtering targets, cutting tools, mill products, metallurgical applications, optical applications, biomedical applications and other miscellaneous applications [Matos et al.,2021]. Figure 13 presents the shares of the main uses of tantalum in the EU. Compared to the global use shares, EU has limited domestic production of tantalum capacitors, but a comparatively strong aerospace and high-performance alloy sector, which is likely to result in a higher relative importance of tantalum use in superalloys and mill products compared to global use shares (Validation workshop).
The calculation of economic importance is based on the use of the NACE 2-digit codes and the value added at factor cost for the identified sectors. The value-added data corresponds to 2022 figures, unless indicated otherwise (Table 7). Figure 14 presents value added per 2-digit NACE sector over time.
| Applications | 2-digit NACE sector | Value added of NACE 2 sector | 4-digit CPA |
|---|---|---|---|
| Capacitors | C26 - Manufacture of computer, electronic and optical products | 110,000M€ | C26 - Manufacture of computer, electronic and optical products |
| Superalloys | C30 - Manufacture of other transport equipment | 75,800M€ | C30 - Manufacture of other transport equipment |
| Mill products | C28 - Manufacture of machinery and equipment n.e.c. | 280,306M€ | C28 - Manufacture of machinery and equipment n.e.c. |
| Sputtering targets | C26 - Manufacture of computer, electronic and optical products | 110,000M€ | C26 - Manufacture of computer, electronic and optical products |
| Carbides | C28 - Manufacture of machinery and equipment n.e.c. | 280,306M€ | C28 - Manufacture of machinery and equipment n.e.c. |
| Chemicals | C20 - Manufacture of chemicals and chemical products | 146,000M€ | C20 - Manufacture of chemicals and chemical products |
The manufacture of capacitors is the largest single use of tantalum worldwide.
All electronic devices contain capacitors, they are used to store an electrical charge for later use, and consist of two conducting surfaces (metal plates) separated by a dielectric insulating material. In the case of tantalum capacitors, the dielectric is a thin film of tantalum pentoxide that forms naturally on the surface of tantalum metal to protect it from corrosion.
The vast majority of capacitors in electronic devices do not contain tantalum; the use of tantalum is favoured when high capacitance, small size and high performance are required. Tantalum capacitors provide high stability and reliability in a wide range of temperatures and frequencies [T.I.C.,2018]. Such capacitors are now limited to applications where they are irreplaceable. In addition to electronics, tantalum capacitors are used in other sectors including automotive components and medical appliances [T.I.C.,2025].
In the EU, the majority of tantalum use in capacitors comes from imported finished products rather than manufacturing. Currently, tantalum capacitors are manufactured in Czech Republic by Kyocera AVX.
When tantalum is alloyed with other metals, typically nickel, it produces superalloys, high performance alloys that can operate at high temperatures, have high strength, and considerable resistance to wear in corrosive and oxidizing environments. These superalloys are used aircraft engines, as well as other types of gas turbines, such as industrial power generators. Typically, a 3-11 % of Ta is used as the alloying element in nickel based superalloys [T.I.C.,2018b].
Superalloys are an important use of tantalum in the EU, due to the prominence of the aerospace sector. Roskill estimates that the EU could consume half of tantalum used globally in superalloys [Roskill,2016]. As aircraft design and performance expectations improve, the alloys involved become more sophisticated and the loading of tantalum in alloys is increasing (together with other specialty metals). Superalloys find applications in the manufacture of jet engines for example, but also for land-based gas turbines.
Tantalum mill products have a very wide range of uses, including chemical processing equipment, ballistics and surgical implants.
Sputtering targets are another major application for tantalum although less important in the EU (only in imported finished products).
Sputtering is a method of applying thin films of metal to a substrate and is used in the manufacture of storage media, inkjet printer heads, electronic circuitry and flat-panel displays, among others. The target is the source of the metal that is deposited. Tantalum sputtering targets are used in a variety of products, including semiconductors, magnetic storage media, inkjet printer heads and flat panel displays [T.I.C.,2025].
Tantalum carbides are used in cutting tools due to their increased high temperature deformation, and good control of grain growth [T.I.C.,2025].
Tantalum chemicals have a very wide range of applications and are intermediates in the manufacture of other products that are often destined for the electronics industry.
Due to the excellent biocompatibility, tantalum coatings are also used in medical applications (such as medical device implants, bone and joint replacements etc) [T.I.C.,2018c], but with a very low share (<1%).
| Use | Percentage | Substitute | Sub share | Cost | Performance |
|---|---|---|---|---|---|
| Capacitors | 35.5% | no substitute | 100% | No substitute | |
| Superalloys | 24% | no substitute | 85% | No substitute | |
| Superalloys | 24% | Mo | 5% | Similar or lower costs | Reduced |
| Superalloys | 24% | V | 5% | Similar or lower costs | Reduced |
| Superalloys | 24% | Re | 1% | Similar or lower costs | Reduced |
| Superalloys | 24% | Nb | 1% | Similar or lower costs | Reduced |
| Superalloys | 24% | Ir | 1% | Very high costs (more than 2 times) | Reduced |
| Superalloys | 24% | W | 1% | Similar or lower costs | Reduced |
| Superalloys | 24% | Hf | 1% | Slightly higher costs (up to 2 times) | Reduced |
| Mill products | 12% | no substitute | 100% | No substitute | |
| Sputtering targets | 11% | no substitute | 100% | No substitute | |
| Carbides | 9% | Ti | 33% | Similar or lower costs | Similar |
| Carbides | 9% | Nb | 33% | Similar or lower costs | Similar |
| Carbides | 9% | W | 33% | Similar or lower costs | Similar |
| Chemicals | 8% | Zr | 33% | Similar or lower costs | Reduced |
| Chemicals | 8% | Pt | 33% | Very high costs (more than 2 times) | Reduced |
| Chemicals | 8% | Ti | 33% | Similar or lower costs | Reduced |
Possible substitutes of tantalum for different uses are presented in Table 8. Substitutes of tantalum for different applications remain the same as in the years 2010-2020. No major change has been identified. Although a range of substituting elements are theoretically available, practical substitution of tantalum is often constrained by design requirements, long certification cycles in critical applications, and the fact that several substitutes are themselves supply-constrained or critical (Validation workshop).
Most capacitors in electronic devices do not contain tantalum, mostly because of their high prices.
Niobium can be used to produce capacitors at lower cost, but they are usually larger and have a shorter lifespan (also considered a critical raw material for the EU since 2011).
Other alternatives are ceramic capacitors (multilayer or monolithic), or standard aluminium capacitors (both are larger in size, have reduced capacitance and are more sensitive to harsh and hot operating conditions).
Due to the superior performance and robustness of tantalum capacitors, they remain the only reliable choice in applications where long-term reliability, size and/or security matters (e.g. automobile anti-lock brake systems, airbag activation systems, satellites, etc.).
In many types of superalloys tantalum is one of several elements added to the base metal (nickel, cobalt or iron) in small, but precise, quantities. Substituting tantalum for another element would dramatically alter the properties of the superalloy.
Once a particular superalloy has been engineered into an aeroengine, or industrial gas turbine, and approved for commercial use, any subsequent change to that superalloy would take many years to become established.
Tantalum plays a critical role in superalloys and in this application it is a relatively minor cost, making substitution unlikely.
There are no substitutes for tantalum in mill products.
There are no substitutes for tantalum in sputtering targets.
Tantalum carbides are used in cutting tools. Other refractory metals which share similar properties of strength and resistance at high temperatures can be substitutes for carbides (tungsten, niobium, titanium, molybdenum), although prices are often comparable (and again, many of the alternatives are also critical materials).
Not assessed (below 10%).
Supply
World Mining Data reports 19 tonnes (in Ta2O5 content) of tantalum production in the EU, in Spain, which corresponds to 1% of the total global production in 2022 [World Mining Data,since 1984].
In January 2022 tantalite/columbite concentrate production commenced in the Penouta open pit mine in the Galicia, Spain. In first 5 months of operation, they produced 29.8 t of tantalite/columbite concentrate with 17-19% of tantalite and 19-21,5 % of columbite (Strategic Minerals Europe Corp, 2022).
Production of tantalum synthetic concentrate is known to take place by Imerys kaolin mine in Echassières, in France, producing between 4.5 and 6 tonnes of Ta2O5 per year as a by-product of tin slag, but the whole amount is exported to Brazil and India [Bourgeois, F., Andreiadis, E., and Lambert, J.-M.,2017] [Matos et al.,2021]. In practice the contribution of domestic production in Spain and France is marginal.
Processing of the imported tantalum raw materials is taking place in Germany, Estonia, Austria, Czech Republic, Belgium and France.

The lates MSA study for tantalum in the EU was for the year 2016 [Matos et al.,2021].
According to this study, EU production of the tantalum processed materials (tantalum oxides Ta2O5 and fluorides K2TaF7) in 2016 amounted to 634 t of tantalum. Input to the EU tantalum refining sector comes entirely from imports of tantalum primary raw materials and from processing of secondary raw materials - in 2016 import is estimated on 355 t of tantalum raw materials and 164 t of tantalum secondary raw materials.
Functional recycling in the EU, which contains domestic EU scrap including old scrap, new scrap from fabrication of the semi-finished products and new scrap from manufacturing of the finished products is an important input of the tantalum for the production of the tantalum processed materials in EU, accounting for 193 t in 2016. These contributions resulted in an end-of-life recycling input rate EOL-RIR of 13% and the end-of-life recycling rate EOL-RR of 40%. However, in 2016 approximately 232 t of tantalum was landfilled and lost in slags, while 32 t was lost due to the dissipation and 74 t due to the non-functional recycling [Matos et al.,2021].
Tantalum is usually co-produced with niobium as they form minerals of similar characteristics which are found in the same types of ore deposits. It is also commonly associated with tin and lithium ores and can be extracted as by-product. About 50-80 % of tantalum world production comes from primary production, 10-30% from scrap recycling and 10-20% from Sn slags [Matos et al.,2021]. Major part of the global primary supply in recent years comes from artisanal and small scale mining from the Great Lakes Region of Central Africa [Damm, S.,2020]. As significant amount of tantalum is produced as a by-product or sourced from artisanal and small-scale mining, effective supply concentration remains relatively high despite the number of producing countries.
Tantalum does not occur in a free state in nature, but in the form of complex oxides and other minerals. It usually occurs together with niobium in the same type of mineral deposits and in minerals of similar characteristics. Whilst at least nineteen tantalum minerals had been recorded as early as 1982 [Foord, E.E.,1982], many of them are only of mineralogical interest. The main ones found in economic quantities are tantalite-columbite, microlite, wodginite and struverite. Tantalum minerals are often associated with cassiterite (the primary source of tin), and such ores are another important source of tantalum.
Tantalite-columbite is an isomorphous series, where tantalum and niobium may substitute with each other. Tantalite is the tantalum-rich end. The common ratios between the two are from 3:1 to 1:3, thus being either tantalo-columbite or columbo-tantalite (which is the most common, also shortened to ‘coltan’ especially in Central Africa). Microlite is the tantalum-rich end member of the microlite-pyrochlore series. Wodginite is less common but was the primary tantalum mineral found in the original Wodgina deposit in Australia (from which it gained its name) and also at the Tanco mine in Canada. Struverite, a variation of rutile, is a low-grade source of tantalum predominately associated with cassiterite in South-East Asia [Burt, R.O.,2016].
All primary tantalum (and niobium) deposits are associated with igneous rocks, and can be grouped into three types, on the basis of the associated igneous rocks:
• Peraluminous pegmatites and granites;
• Alkaline to peralkaline granites and syenites;
• Carbonatite-hosted deposits;
• Placers, paleoplacers and laterites.
Pegmatites have been, and continue to be, the most important source of tantalum mineralization, although only a very small fraction of pegmatites do contain tantalum. The two main periods where tantaliferous pegmatites were intruded are in the Archaean (>2.5 billion years ago) and the Proterozoic (500-1,400 million years ago) [Burt, R.O.,2016]. Pegmatites are enriched in aluminium compared to the alkali-based minerals (sodium and potassium-rich minerals) [?erný, P.,1989]. Pegmatites are generally relatively small (1-100 million tonnes). They can be ‘simple’ or ‘complex’, with several discrete zones within the pegmatite, each zone containing significantly different mineral assemblages. In Central Africa many small pegmatites are found, which have been heavily weathered to the point of kaolinization and have become soft-rock deposits, particularly appropriate for artisanal exploitation.
Alkaline granites are enriched in the alkali-based minerals compared to aluminium. They generally occur in rift or failed rift tectonic settings and are often relatively large deposits (100-1,000 million tonnes), with fine mineralogy [Burt, R.O.,2016]. These rocks typically contain high contents of zirconium and rare earth elements (REEs) minerals. Significant concentrations of niobium and tantalum also occur, with the primary mineral being pyrochlore. A major example is the Pitinga mine in Brazil which is a Paleoproterozoic albite-rich peralkaline granite, exploited for tin, niobium and tantalum.
Syenites are another form of alkali feldspathic rock, with dominant nepheline syenite, generally highly complex. The Lovozero deposit in northern Russia is a prime example of an operating mine where tantalum and niobium are important by-products.
Carbonatites are igneous rocks that contain more than 50% carbonate minerals (calcite, dolomite or ankerite). Carbonatites are often associated with alkaline silicate rocks and typically form relatively small intrusions or ring-complexes but in some cases may form larger plutons. Many carbonatites are surrounded by a fenitic aureole produced by metasomatic alteration of the country rocks. Most carbonatites occur in rift settings, although several different types exist, many of which are unmineralized. Some can contain anomalous niobium-tantalum concentrations, along with various rare earth minerals. They are the main sources of niobium extraction. On carbonatites exposed to the warm and humid tropical conditions which cause deep and extensive weathering of the bed rock, lateritic residual deposits can form also, which can contain significant ore grades.
Placers are deposits of heavy minerals transported by a medium such as moving water, or more uncommonly, wind. Their formation is related to localised decrease in the transport capacity (i.e. energy) of the medium, leading to rapid loss of the higher-density components in the transported fractions.
The often hard and dense oxides comprising the major Nb-Ta oxide minerals can easily form such deposits when weathered primary occurrences or deposits are subjected to fluvial erosion and transport. In the case of most better-known Nb-Ta-enriched placers, they occur in relative vicinity of the original host pegmatites, such as in the case of the Mumba tin-tantalum gravel deposit in the Democratic Republic of Congo, where the presence, and hence survival, of softer heavy minerals attest to a quite short distance of fluvial transport (DERA, 2018).
No data exists on a precise evaluation of tantalum resources worldwide.
| Country | Reserves (million tonnes) |
|---|---|
| Brazil | 0.040 |
| China | 0.240 |
| Australia | 0.110 (among which 0.028 JORC compliant) |
| Others | N.A. |
| Total | > 0.390 |
The world reserves of tantalum exceed 390,000 t as presented in Table 10 [USGS,2025]. Additionally, 55,000 t of tantalum resources are reported for United States but are considered as uneconomic at current tantalum price. These figures can be considered as minimum since resources or reserves in e.g. Central Africa are not evaluated nor reported. Despite the fact that most of the countries do not report tantalum reserves and resources, tantalum reserves are considered sufficient to meet projected demand. World tantalum production is largely dependent on columbite-type minerals, i.e., mainly Fe-Mn-Nb-Ta-oxides from evolved granites and granitic pegmatite-aplite systems as well as on Nb-Ta-enriched cassiterite [Reginiussen, H. et al. ,2021].
| Deposit name | Company | Country | Host rock | Resources |
|---|---|---|---|---|
| Alberta II | Strategic Minerals Europe Corp | Spain | Pegmatites | 12.3 Mt with 0.0121% Ta2O5, 0.044% Sn, 0.204% Li (Bourgeois et al., 2017) |
| Motzfeldt | Stallion Resources | Greenland (Denmark) | Syenite | 340 Mt with 0.19% Nb2O5, 0.012% Ta2O5, 0.46 % ZrO2 (Bourgeois et al., 2017) |
| Rosendal – Kemiö Island | - | Finland | Pegmatites | 1.3 Mt at 0.021 % Ta, 0.014 % Be and 0.08 % Sn (Olivera et al., 2021) |
| Sokli | Finnish Minerals Group | Finland | Carbonatite | 250 Mt of at 0.21 % Nb and 0.005 % Ta |
Penouta mine in Spain opened at the beginning of 2022. Its resources are reported on 7.6 million tonnes measured resources with 85 ppm of tantalum (103 ppm of Ta2O5), 68.6 million tonnes of indicated resources with 72 ppm of tantalum (88 ppm of Ta2O5), and 57 million tonnes of inferred resources with 62 ppm of tantalum (76 ppm of Ta2O5) according to the Canadian NI 43-101 reporting code [Strategic Minerals,2022]. As of July 2025, the mine had financial difficulties and was looking for a bidder [Mining Weekly,2025].
Reserves of second producing tantalum mine – the Imerys kaolin mine in Echassières in France are not public [Schwela, Ulric ,2019]. The main tantalum bearing mineral in the kaolinized granite are microlite and tantalo-columbite.
Besides already mentioned projects some of the more developed exploration projects in the EU with resource estimations are listed in Table 11.
Most of the discovered European tantalum mineralisation are associated with evolved granites, granitic pegmatites and associated aplites which occur in the Palaeoproterozoic rocks of the Fennoscandian Shield and rocks of Variscan orogen in the continental Europe and Ireland [Reginiussen, H. et al. ,2021]. Mineral deposits and occurrences in the EU that contain tantalum (and niobium) are reported from Finland, Sweden, Greenland, Portugal, Spain, France, Germany, Czech Republic and Romania.
Elu et al. (2021) state that known tantalum resources of Finland amount on 477 t, Greenland on 1,093,147 t and Sweden at 68 t. Contrarily, [Lauri et al.,2018] states that tantalum resources in Finland comprise of minimum 12,786 t Ta metal.
Furthermore 13,670 t of tantalum resources are reported at the Krásno and Cínovec area, Czech Republic, with recoverable tantalum contents in experimental tin and tungsten concentrates and 57 t of tantalum historical prognostic resources at the H?rky locality [Starý,2021]. [Lauri et al.,2018]) describe French tungsten-lithium-tantalum deposits the Tréguennec deposit, with 1,950 t of Ta2O5 and 1,860 t of Nb2O5 estimated resources and the Les Montmins deposit, which contain 24,000 t of Ta2O5.
According to the [Reginiussen, H. et al. ,2021], the most promising areas for tantalum exploration in EU (which has also the largest number of known deposits and occurrences) are:
• The Variscan Galicia-Centro Iberian Pegmatitic Province including the Central-Iberian Zone (CIZ) and the Galicia Trás-os-Montes Zone (GTMZ).
• The Massif Central and Armorican massif of France.
• The Fennoscandian Shield with rare element granites, granitic pegmatites and aplites as well as carbonatites.
• Greenland (carbonatites in the W and alkaline igneous rocks in the S and E).
• Bohemian Massif
• The Eastern Carpathians especially in Romania (alkaline igneous rocks)
The identified deposits and occurrences in Europe are available also on EGDI web viewer. Lauri et al. (2018) reports also of tantalum occurrences in Austria, Bulgaria, Italy and Slovakia, but majority of those have only mineralogical significance.
No data on reserves at the EU level.
According to the WMD global mine production of tantalum between 2010 and 2023 ranged from 655 t (2010) and 1,887 t (2017) (Figure 16). Data from USGS for the last 10 years approximately comply with the WMD data (Figure 17).
Main producing countries of tantalum are Democratic Republic of Congo, Rwanda, Brazil, Ethiopia, and Nigeria, with shares of 41%, 20%, 14%, 8%, and 7% of the total production, respectively. Until 2008 Australia was the most important supplier of tantalum, but its production decreased significantly and now accounts only minor share in global production. The highest rise of tantalum production the last decade is observed for Democratic Republic of Congo. [World Mining Data,since 1984]
Due to the Penouta open pit mine in Spain operational since January 2022, also EU is a primary producer of tantalum. In first five months of operation 29.8 t of tantalite/columbite concentrate with 17-19% of tantalite and 19-21,5 % of columbite was produced.
In addition, Imerys kaolin mine in Echassières, in France produced minor quantities of the synthetic concentrate (between 4.5 and 6 t) which was exported completely [Bourgeois, F., Andreiadis, E., and Lambert, J.-M.,2017] [Matos et al.,2021].
According to [Matos et al.,2021], EU tantalum processing sector used 164 t of imported secondary raw material and 2 t of imported waste for the tantalum production in 2016. Secondary tantalum from domestic scrap (old scrap, new scrap from fabrication of semi-finished products as well as new scrap from manufacturing of finished products, referring to “functional recycling”) is also an important input (193 t tantalum content –108t of new scrap and 85 t of old scrap) to produce tantalum processed materials.
The collection rate for tantalum products in EU is estimated at 45% in 2016. However, only 15% end of life products were collected and sorted for functional recycling in the EU (85 t). According to [Matos et al.,2021], end-of-life recycling input rate (EOL-RIR) in 2016 for tantalum in EU results in 13%. The ratio of functional recycling of old scrap and tantalum collected results in 40% for end-of-life recycling rate (EOL-RR).
DERA (2018) estimated the tantalum recycling rate to be 30%, where reprocessing of super alloys from aviation industry and sputtering targets from electronics industry are responsible for most of the recycled tantalum material.
| MSA Flow | Value (tonnes) |
|---|---|
| B1.1 Production of primary material as the main product in EU sent to processing in EU | 0 |
| B.1.2 Production of primary material as a by-product in EU sent to processing in EU | 0 |
| B.1.3 Exports from EU of primary material | 6 |
| C.1.3 Imports to the EU of primary material | 355 |
| C.1.4 Imports to the EU of secondary material | 164 |
| D.1.3 Imports to the EU of processed material | 54 |
| D.1.9 Imports of secondary material send to manufacturing in the EU | 44 |
| G.1.1 Production of secondary material from post-consumer functional recycling in the EU sent to processing in the EU | 193 |
| G.1.2 Production of secondary material from post-consumer functional recycling in the EU sent for manufacturing in the EU |
In contrast to recycling new scrap, the recovery of tantalum from old scrap is less significant. Major use for tantalum is capacitors in electronic devices, and no mature technology has been developed in industrial scale to recover tantalum from end-of-life electronic products. Tantalum recycling from post-consumer electronic waste is facing several technical bottlenecks [Kurylak, W., Retegan, T., Bru, K., Mennade, N., Cassayre, L., Sundqvist, L., Ye, G., Yang, J., Koffeman, J., Yang Y., Leszczynska-Sejda, K., Benke, G. ,2016]:
- In electronic devices, tantalum is concentrated in components dispersed into PCBs and consequently is difficult to selectively recover and concentrate.
- Tantalum compounds are covered by several layers of minerals (manganese dioxide, MnO2) and plastics (carbon). This intimate mixing between parts of different chemical composition impedes recycling process to efficiently separate tantalum.
- In addition, during the widely developed pyro-metallurgical copper route used by e-waste recyclers in Europe (such as Boliden and Umicore), Ta easily oxidizes and migrates into the slag phases.
For the recovery of tantalum from WEEE, an important step is the extraction of Ta-containing WEEE and PCBs from the Ta poor WEEE fractions [Nieberl, M., Hornung, A., Sajdak, M., Majewski, A. J., Ouadi, M.,2023]. Proposed general flowsheet for the recovery of tantalum from WEEE is presented in Figure below.

Figure Flowsheet to recover tantalum from WEEE. [Nieberl, M., Hornung, A., Sajdak, M., Majewski, A. J., Ouadi, M.,2023]
Tantalum can be recovered from scrap, incineration bottom ash, superalloys, pyrometallurgical slag, and tin slag following the processes described in Figure 16. Majority of recycling can be considered as ‘pre-consumer’ that is from within the upstream supply chain itself, rather than from end-of-life products.
Different kinds of tantalum processing and manufacturing wastes are recycled internally within the tantalum industry. The suitable recycling route depends on the tantalum grade, as illustrated in Figure below. High-grade tantalum waste can be recycled in the chemical/metallurgical process along with ore concentrates and high-grade slags from tin production. Examples of high-grade tantalum waste include
- alloy scraps, impure cuttings and turnings, and flue dust,
- condensates on cold surfaces in melting furnaces
- residues from reduction of K2TaF7
- off-specification tantalum powder
- deposits on sputtering chamber walls (overspray)
- spent tantalum targets
- cuttings, turnings, and grinding powder from LiTaO3-wafer manufacturing [Nieberl, M., Hornung, A., Sajdak, M., Majewski, A. J., Ouadi, M.,2023]
Pyrometallurgical process can be used to recycle low-grade tantalum wastes such as manufacturing wastes and rejects from downstream processes, sweepings, slimes from powder production or wastewater treatment, low-grade slags from tin production, slags and dust from the pyrometallurgical process itself as well as leaching residues from chemical/metallurgical processing. However, the process is energy intensive and the produce syncon still requires further refining. [Nieberl, M., Hornung, A., Sajdak, M., Majewski, A. J., Ouadi, M.,2023]

Figure Recycling of tantalum manufacturing wastes of different origin. [Nieberl, M., Hornung, A., Sajdak, M., Majewski, A. J., Ouadi, M.,2023]
Primary tantalum ore is processed in the following sequence [Bourgeois, F., Andreiadis, E., and Lambert, J.-M.,2017]:
- Crushing (jaw, cone or impact crusher) to fraction below 15-20 mm
- Grinding (ball or rod milling) and classification (screens and hydrocyclones) in closed circuit to below 1 mm.
- Conventional (jig, shaking table), centrifugal (spiral) and enhanced gravity separation (MGS, Falcon concentrator), depending on the size of the liberated particles. The gravity separation takes advantage of the high density of the Ta-bearing phases, with specific density in the range 6 to 8.
- Selective reverse flotation to concentrate the finest material
- Low and high intensity magnetic separation to remove companion magnetic phases.
- Thickening circuit to recycle the process water
Known processing issues are production of unrecoverable Ta ultrafine fractions which are lost to the tailings, presence of the radioactive mineral phases and high costs due to high consumption of flotation additives (which can present also an environmental risk). [Bourgeois, F., Andreiadis, E., and Lambert, J.-M.,2017]
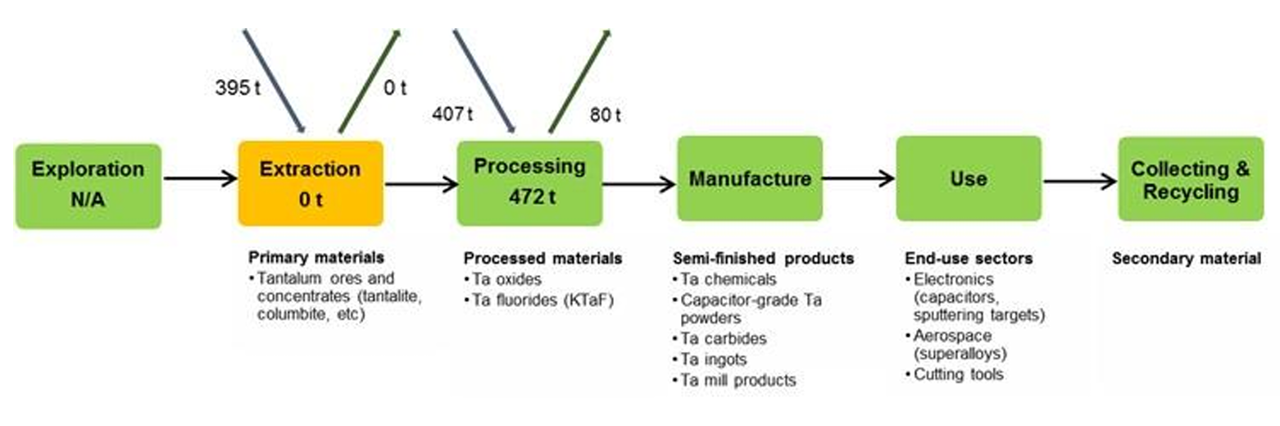
Production of tantalum products involves many steps. First tantalum concentrates are converted to an intermediate chemical, e.g. K2TaF7 or Ta2O5, which are further processed into intermediate products, such as chemicals (for example tantalum chlorides) or metal powders (metallurgical grade at 99.95% purity or capacitor grade at 99.99% purity). Finally, tantalum intermediate products are converted into semi-finished products (such as capacitors), which are incorporated into finished products (e.g. electronic products). [Matos et al.,2021] The main processing pathways of the primary tantalum concentrates and tantalum scrap to produce refined material used for manufacture of end products are presented in Figure below.

Figure General chart for tantalum production from scrap and primary materials [Bourgeois, F., Andreiadis, E., and Lambert, J.-M.,2017]
Furthermore, relations between different tantalum intermediate products and end uses are illustrated in Figure below. The most important processed tantalum intermediates by global shipments of products were capacitor-grade powder (25.5% of shipment in Ta content), metallurgical-grade powder (22.6%), chemicals (21.5%), mill products (15.4%), and ingots (12.3%) [RMIS,2024b].

Figure Manufacturing steps in the tantalum value chain [Matos et al.,2021]
WMD, BGS and USGS report tantalum production at the extraction stage. There is no Eurostat trade code for processed tantalum, tantalum oxides and fluorides, in ProdCom and in Eurostat-Comext.
The world production of intermediate products is not known. T.I.C (2019) reported an estimate annual production of approximately 2,200 tonnes of intermediates, including Ta2O5, and K2TaF7, as well as secondary products, equivalent to 1,200 tonnes of tantalum metal content [T.I.C.,2019]. The top three producers of tantalum processed materials are China, Germany, and the United States. No exact production shares are available [Schwela, Ulric ,2019]. Top producers of tantalum (by a number of smelters, refineries, and processors) as of 2023 were China, United States, Japan, Germany, Brazil and Estonia [RMIS,2024b].
Even though producing countries are quite diverse at the extraction stage, the next steps of tantalum value chain are more concentrated in Asia. The International Trade Administration (ITA, 2020) reported a list of 37 identified companies known to be able to process tantalum ores and concentrates and produce industrial tantalum products. According to this list, 18 tantalum processing facilities were located in China. China is the main importer of tantalum concentrates globally and is also a major exporter of processed Ta-products, to the EU, US and others.
Other considerations
Tantalum oxide and metallic tantalum, represent a skin, eye and respiratory hazard. In alloys with other metals such as cobalt, tungsten and niobium, tantalum has been attributed an aetiological role in hard-metal pneumoconiosis and in skin affections caused by hard-metal dust [ILO,2011c].
Occupational exposure limits are set in various countries. The Occupational Safety and Health Administration (OSHA, USA) set the legal limit (permissible exposure limit) for tantalum exposure in the workplace as 5mg/m3 over an 8-hour workday [OSHA,2021]. The National Institute for Occupational Safety and Health (NIOSH, USA) has set a recommended exposure limit (REL) of 5 mg/m3 over an 8-hour workday and a short-term limit of 10 mg/m3 [NIOSH,2019].
Around 20 % to 25 % of tantalum are mined in artisanal operations associated with soil erosion and deforestation. The natural radioactivity of tantalum concentrates and processing waste presents a challenge for global supply chain logistics and waste management [Schütte,2021].
Tantalum is one of the “conflict minerals” covered by Regulation (EU) 2017/821, which establishes due diligence requirements for EU importers of tin, tantalum, tungsten, and gold, and by the US Dodd-Frank Act. It is also in the scope of the OECD (2017) “Due Diligence Guidance for Responsible Supply Chains of Minerals from Conflict-Affected and High-Risk Areas” [OECD,2016] and the “ASM Code of Conduct” published by Tantalum-Niobium International Study Center [T.I.C. ,2022].
Trade restrictions for tantalum ores and concentrates are in place in China, Ethiopia and Nigeria (licensing requirement) and in Burundi, DRC and Rwanda (fiscal tax on exports) in 2022 [OECD,2024A].
Table 14 lists the countries for which the economic value of exports of niobium, tantalum and vanadium ores and concentrates represents more than 0.1% of the total value of their exports in 2023 [OEC,2025]. It should be noted, however, that this trade code combines niobium, tantalum and vanadium ores and concentrates, and it is not possible to disaggregate the share of economic importance for tantalum alone.
For other tantalum trade codes, the share of economic value of exports of the total exports did not exceed 0.1 % for any of the exporting country.
| Country | Export value (USD) | Share in total exports |
|---|---|---|
| Rwanda | 102353880 | 7,59 % |
| Ethiopia | 24476059 | 0,62 % |
| Democratic Republic of the Congo | 83120519 | 0,40 % |
| Sierra Leone | 4315992 | 0,28 % |
| Mozambique | 31711374 | 0,27 % |
| Republic of the Congo | 25903227 | 0,22 % |
| Nigeria | 123146531 | 0,20 % |
Tantalum mining and trade is related to armed conflicts and severe human rights violations and is therefore considered a conflict mineral in legislation (c.f. section “Standards and normative Requirements related to use and processing of the material“). In addition to the conflict minerals issue, 20 % to 25 % of mined tantalum is produced by artisanal and small-scale mining (ASM). ASM often is characterised by vulnerability (limited capacity to cope with shocks and hazards) and marginalisation (as it is usually practised in remote areas, with limited access to markets. [Schütte,2021]
• Hydrogen production
Tantalum oxides, nitrides (e.g. Ta3N5), and oxynitrides (e.g. TaON) are being actively investigated as photoanode materials for hydrogen production via solar water splitting, due to their suitable band structures and chemical stability [Wang P., et al.,2025] [Grandcolas M., et al.,2025] [Pihosh Y., et al.,2023]. Recent research focuses on improving charge transfer, interface engineering, and stability, as current performance remains below theoretical limit.
• Energy storage systems
Lithium-ion batteries are at the heart of the electric vehicle (EV) revolution. As such, they are a critical component in reducing the carbon footprint from transportation. Tantalum is being explored in lithium-ion batteries mainly as a dopant in cathode materials, where small additions of tantalum oxides can improve structural stability, reduce degradation, and enhance safety, particularly in Ni-rich cathodes [Monsees F., et al.,2024] [Worku Y. S. et al,2025] [Geng C., et al.,2024]. These developments support longer battery lifetimes but rely on very low tantalum contents.