Overview
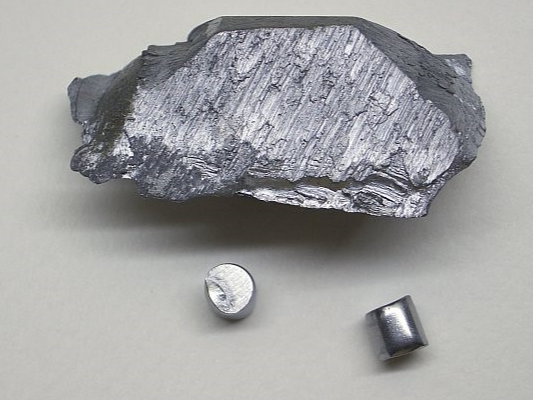
Vanadium (chemical symbol V) is a steel-grey, bluish, ductile metallic element with the atomic number 23. It has a very high melting point, and resists corrosion. Its main application is as an additive in steel and titanium alloy steels to improve their strength and resistance to heat and corrosion, as well as a catalyst for chemicals (Brown et al. 2016). While vanadium can be produced through primary (mine) production, production predominantly occurs via co-production pathways, where vanadium is obtained as a by-product of iron and steel production. A minor share is derived from secondary sources such as petroleum residues, fly ash, and spent catalysts.
Attribution of the figure: This file is available from https://commons.wikimedia.org/wiki/File:Vanadium2.jpg and licensed under the Creative Commons Attribution-Share Alike 3.0 Unported license.
| Global production | Global producers | EU consumption | EU share | EU suppliers | Import reliance |
|---|---|---|---|---|---|
| 112,129t | China 68% Russia 18% South Africa 8% Brazil 6% | 0t | 0% | 0% |
| Global production | Global producers | EU consumption | EU share | EU suppliers | Import reliance |
|---|---|---|---|---|---|
| 124,305t | China 65% Russia 7% Europe 7% South Africa 7% Brazil 5% North America 3% Japan 2% | 3,840t | 3% | Russia 30% South Africa 17% Korea, South 14% Latvia 8% China 8% Brazil 7% | 84% |
Vanadium prices have been mostly driven by the steel industry and structural changes in the supply side. Figure 2 shows the annual average price of vanadium pentoxide between 2000 and 2024. The average price for 2020-2024 was 6€/pound (13.2€/kg) of vanadium pentoxide, maximum being 8.7€/pound (19 €/kg) in 2022, and minimum 2.6€/pound (6 €/kg) in 2020.
The EU has small reserves of vanadium in Finland and Sweden, but does not mine nor import significant amounts of vanadium in ores. Vanadium is imported to the EU mainly in the form of oxides and hydroxides, and ferrovanadium. In 2024, EU imported about 3118 tonnes of vanadium oxides and hydroxides, of which 67 % from Russia. The second main intermediate product was ferrovanadium with a total import of around 2650 tonnes, of which 50 % from South Africa.
The recycling of vanadium is generally very low. Two main kinds of secondary vanadium scrap can be discerned: steel scrap, which was recycled along with the vanadium content, and spent chemical process catalysts [Mathieux, F. et al,2017]. Also, certain vanadium-bearing tools can be recycled [Petranikova M. et al.,2020]. The EoL-RIR of vanadium in the EU in 2022 was 1 % [Eurostat,2023].
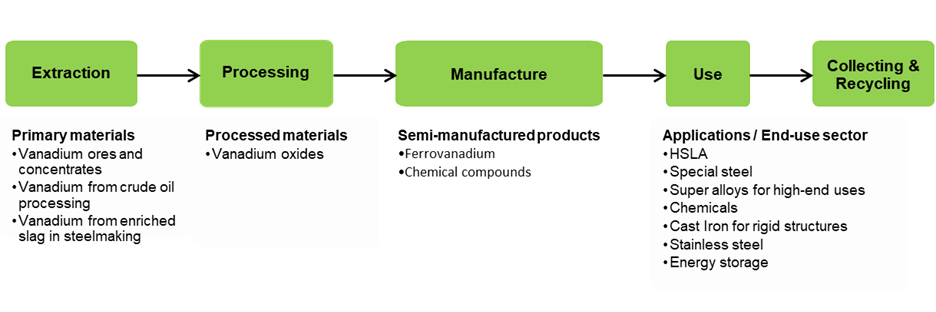
Vanadium is mainly used in the production of high-strength low-alloy (HSLA) steels, special steels, chemicals, stainless steels, superalloys, and energy storage.
| Use | Percentage | Substitute | Sub share | Cost | Performance |
|---|---|---|---|---|---|
| High-strength low-alloy steels | 64% | no substitute | 49% | No substitute | |
| High-strength low-alloy steels | 64% | Niobium | 15% | Slightly higher costs (up to 2 times) | Reduced |
| High-strength low-alloy steels | 64% | Tungsten | 8% | Slightly higher costs (up to 2 times) | Similar |
| High-strength low-alloy steels | 64% | Titanium | 8% | Similar or lower costs | Reduced |
| High-strength low-alloy steels | 64% | Molybdenum | 8% | Slightly higher costs (up to 2 times) | Similar |
| High-strength low-alloy steels | 64% | Manganese | 8% | Similar or lower costs | Reduced |
| Special steel | 21% | no substitute | 42% | No substitute | |
| Special steel | 21% | Niobium | 15% | Slightly higher costs (up to 2 times) | Reduced |
| Special steel | 21% | Tantalum | 15% | Very high costs (more than 2 times) | Similar |
| Special steel | 21% | Molybdenum | 8% | Slightly higher costs (up to 2 times) | Similar |
| Special steel | 21% | Manganese | 8% | Similar or lower costs | Reduced |
| Special steel | 21% | Tungsten | 8% | Slightly higher costs (up to 2 times) | Similar |
| Special steel | 21% | Chromium | 4% | Slightly higher costs (up to 2 times) | Reduced |
| Chemicals and battery oxides | 5% | no substitute | 80% | No substitute | |
| Chemicals and battery oxides | 5% | Nickel | 20% | Similar or lower costs | Reduced |
| Stainless steel | 4% | no substitute | 65% | No substitute | |
| Stainless steel | 4% | Niobium | 15% | Slightly higher costs (up to 2 times) | Reduced |
| Stainless steel | 4% | Cobalt | 8% | Slightly higher costs (up to 2 times) | Similar |
| Stainless steel | 4% | Boron | 8% | Similar or lower costs | Reduced |
| Stainless steel | 4% | Chromium | 4% | Similar or lower costs | Reduced |
| Super alloys for high-end uses | 3% | no substitute | 85% | No substitute | |
| Energy storage | 3% | no substitute | 80% | No substitute | |
| Energy storage | 3% | Nickel | 20% | Similar or lower costs | Reduced |
| Super alloys for high-end uses | 3% | Rhenium | 3% | Very high costs (more than 2 times) | Similar |
| Super alloys for high-end uses | 3% | Tantalum | 3% | Very high costs (more than 2 times) | Similar |
| Super alloys for high-end uses | 3% | Zirconium | 3% | Slightly higher costs (up to 2 times) | Similar |
| Super alloys for high-end uses | 3% | Boron | 3% | Similar or lower costs | Reduced |
| Super alloys for high-end uses | 3% | Light Rare Earths | 3% | Very high costs (more than 2 times) | Reduced |
Substitutes of vanadium for different applications remain the same as in the years 2010-2020. No major change has been identified.
In steels, substitution of vanadium is possible to a certain extent, although it is limited by the poorer performance of common substitute elements in some applications. Steels containing vanadium as an alloying element can, to some extent, be replaced by steels containing various combinations of other alloying elements, including manganese, molybdenum, niobium, titanium, and tungsten (USGS, 2025). Nonetheless, it should be stressed that replacing vanadium with other alloying elements requires significant technical adjustments to the steel production process.
Global demand for vanadium is expected to increase in the medium to long term, driven primarily by demand for high-strength steels used in construction, automotive, and other industrial applications. In addition, the growing deployment of Vanadium Redox Flow Batteries (VRFBs) for large-scale energy storage could create a significant new source of demand. While steel is expected to remain the principal end use by volume, increasing demand from energy storage applications may place additional pressure on global vanadium supply chains in the future.
Trade restrictions for vanadium ores and concentrates are in place in China (licensing requirement) in 2022 [OECD,2024A].
Market analysis, trade and prices
| Global production | Global producers | EU consumption | EU share | EU suppliers | Import reliance |
|---|---|---|---|---|---|
| 112,129t | China 68% Russia 18% South Africa 8% Brazil 6% | 0t | 0% | 0% |
| Global production | Global producers | EU consumption | EU share | EU suppliers | Import reliance |
|---|---|---|---|---|---|
| 124,305t | China 65% Russia 7% Europe 7% South Africa 7% Brazil 5% North America 3% Japan 2% | 3,840t | 3% | Russia 30% South Africa 17% Korea, South 14% Latvia 8% China 8% Brazil 7% | 84% |
The main global producers of vanadium at extraction stage are presented in Table 4. The global production in 2019-2023 was 109,373 tonnes and largest producers China, Russia, South Africa, and Brazil, with shares of 68%, 18%, 8% and 6%, respectively.
The main global producers and EU suppliers of vanadium at processing stage are presented in Table 5. The global production in 2019-2023 was 124,305 tonnes and largest producers China, Russia, Europe, and South Africa, with shares of 65%, 7%, 7% and 7%, respectively. Largest suppliers to the EU were Russia, South Africa, South Korea, and Latvia, with shares of 30%, 17%, 14%, and 8% of the total EU supply in the period 2019-2023. The import reliance of EU was 84% for the processing stage.
The market demand for vanadium closely follows the steel industry since most of the world’s vanadium is added to steel as ferrovanadium [USGS,2025]. The importance of vanadium redox flow batteries (VRFB) has increased in recent years due to the demand for large scale energy storage, and is already the second largest use of vanadium after steel [Bushveld Minerals,-].
The main vanadium commodities include aluminum-vanadium master alloys, ferrovanadium (FeV), vanadium oxides and hydroxides (such as vanadium trioxide, V2O3), vanadium chemicals, vanadium pentoxide (V2O5), as well as vanadium-bearing ash, residues, and slag. Among these, V2O5 is the most widely produced oxide, and the majority of both V2O5 and V2O3 is further processed into ferrovanadium [Polyak D. E.,2023]. The key companies in the vanadium market include Australian Vanadium, Bushveld minerals, EVRAZ, Largo Resources, AMG advanced metallurgical, Angang steel, Glencore, HBIS, Treibacher Industries, and Atlantic [Research and Markets,2024].
| Mining | Processing/refining | ||
|---|---|---|---|
| CN Code | Title | CN Code | Title |
| 0-26159000 | Unknown | 28253000 | Vanadium oxides and hydroxides |
| 72029200 | Ferro-vanadium | ||
| 81129291 | Unwrought vanadium; vanadium powders (excl. ash and residues containing vanadium) | ||
For the purpose of this assessment, vanadium is evaluated at processing stage. Relevant Eurostat CN trade codes for vanadium are listed in Table 6. These include 28253000 – Vanadium oxides and hydroxides (vanadium content 30%), 72029200 – ferrovanadium (vanadium content 60%), and 81129291 unwrought and powders (vanadium content 99%).
In the absence of a relevant method to disaggregate the share of each element in the annual statistics of the CN code 26159000 (Niobium, tantalum or vanadium ores and concentrates), vanadium is not analyzed at the extraction stage.
These codes are also not capturing a major vector of vanadium that is vanadium slag. Indeed, they are classified as 261800: Granulated slag (slag sand) from the manufacture of iron or steel, or 261900: Slag, dross (other than granulated slag), scalings, and other waste from the manufacture of iron or steel. It is also not possible currently to disaggregate data in order to separate vanadium slag from the other steel and iron slags. Therefore, some imports or exports of vanadium remain invisible, even though it is a major source of vanadium production. It contributes to the discrepancy between the absence of vanadium raw material import in the EU but an actual existing european production of processed vanadium.
Figure 5 and Figure 6 show the EU trade flows and imports of ferrovanadium (CN 72029200) by country between 2000 and 2024.
The imports of ferrovanadium varied from 3,568 t in 2000 to 2,650 t in 2024; the ferrovanadium exports were slightly higher than imports in 2018-2020, but decreased from 4,312 t in 2022 to 683 t in 2024. The main supplier of the EU of ferrovanadium in 2024 was South Africa, which represents 50% of total EU’s imports in the period, followed by South Korea (33%) and China (16%). The suppliers of ferrovanadium imports have changed in this period as there were major imports from Russia between 2000 and 2008, while there has been a switch to other suppliers, such South Africa, South Korea and China, in past 15 years.
Figure 7 and Figure 8 show the EU trade flows and imports of vanadium oxides and hydroxides (CN 28253000) by country between 2000 and 2024.
Over the whole period, the EU was a net importer of vanadium oxides and hydroxides. The imports of vanadium oxides and hydroxides varied from 1,043 tonnes in 2009 to 4,609 tonnes in 2021, while vanadium oxides and hydroxides exports ranged between 4 tonnes (2024) and 246 t (2011) per year. In 2024 the imports of vanadium oxides and hydroxides to the EU were 3,118 tonnes and the major supplier of the EU was Russia, which corresponds to 57% of EU's vanadium oxide and hydroxide imports. Rest of the world, South Africa and China, followed with 21%, 7%, 5%, and 5% of total vanadium oxide and hydroxide EU’s imports, respectively.
Figure 9 and Figure 10 show the EU trade flows and imports of unwrought vanadium and vanadium powders (CN 81129291) by country between 2000 and 2024.
Since 2018, the EU has been a net exporter of unwrought vanadium and vanadium powders. In 2024, the exports were 582 tonnes, whereas imports were 182 tonnes. The main suppliers of the EU of unwrought vanadium and vanadium powders in 2024 were UK, Lebanon, China, and US, with 33%, 33%, 27%, and 5% of the total supply, respectively.
Figure 13 shows the annual average price of vanadium pentoxide between 2000 and 2024. The average price for 2020-2024 was 6€/pound (13.2€/kg) of vanadium pentoxide, maximum being 8.7€/pound (19 €/kg) in 2022, and minimum 2.6€/pound (6 €/kg) in 2020.
The price volatility of ferrovanadium was around 37% between January 2019 and December 2024 but decreased to 10 % in the period January 2024 and December 2024 [DERA,2024].
Vanadium prices in 2000-2020 have been mostly driven by the steel industry and structural changes in the supply side [USGS mineral summaries,2000-2025]. For example, price changes between 2017 and 2019 were linked to the changes of vanadium production in South Africa, where some operations were shut down in 2018, but reopened in 2020 and started to stockpile materials (USGS, 2021; VanadiumCorp, 2017). At the same time, new construction standards in China mandating the use of higher-quality rebar increased the demand for vanadium [Project Blue,2022].
Vanadium prices have been driven by the steel production prices. However, the replacement of ferroindium for ferrovanadium and the development of vanadium redox flow batteries have started to grow vanadium demand, which influences price changes for vanadium [Court, M.,2021].
Global demand for vanadium is expected to increase in the mid to long term across all of its major applications (steel and non-ferrous alloys, chemicals, batteries). The global demand for vanadium is largely dependent on the steel market and specifically on the Chinese steel industry [USGS mineral summaries,2000-2025], since China is both the largest producer and consumer of crude steel [World Steel,2024]. The global demand for high-strength steel, the primary use of vanadium, is expected to increase in various sectors: the construction, automotive, and aerospace [Grand View Research,-]. The demand coming from steel is expected to rely primarily on intensity rather than on volume [Bushveld Minerals,-]. For example, new construction standards in China mandate the use of micro-alloyed steel in reinforcing bars, which is expected to increase the demand for vanadium [Fastmarkets,2024].
In particular, demand for Vanadium Redox Flow Batteries (VRFB) could drive a rapid increase in demand for vanadium in the coming decades, as the share of renewable energy with large scale and long-duration battery storage in the global energy mix increases. The market of VRFB is expected to rise rapidly in 2024-2030 [Grand View Research,-]. The market is developing quickly especially in Asia (China, Japan, South Korea), US, Canada and Australia [Bielewski, M., Pfrang, A., Quintero Pulido, D., Bobba, S., Georgakaki, A., Letout, S., Kuokkanen, A., Mountraki, A., Ince, E. and Shtjefni, D.,2023] [Flow Batteries Europe,2024]. Currently the largest VRFB installations have been completed in China [Murray, C. ,2024]. According to Ciotola et al. (2021)Germany alone could require between 65 and 650Kt of vanadium to meet its energy storage needs in 2050, depending on the market share of the VRFBs compared to other energy storage technologies [Ciotola, A., Fuss, M., Colombo, S., & Poganietza, W.-R. ,2021]. This potentially dramatic increase in demand may pose challenges for global vanadium supply chains, since vanadium is produced as a by-product metal and mines may not be able to increase output capacity in line with demand (ibid). The volatility of vanadium prices is one of the key barriers to wider deployment, as vanadium can account for 30-50 % of the overall system cost. Thus to date, despite growing demand from VRFBs, steel remains the main end use by volume. (Validation workshop 2026).
Demand
The global consumption of vanadium has been 103,000 to 124,000 tonnes in 2020 – 2025 [Vanitec,-]. Steel is the dominant use sector for vanadium globally, accounting for over 90% of the vanadium demand in 2022. Of the global consumption, China accounted for 56% in 2024, followed by North America (11%), EU27 (10%), and Asia (excluding China and India) (8%) [Vanitec,-] [Project Blue,2022].
The EU consumption of vanadium is evaluated at processing stage. For vanadium processing stage the EU consumption is presented by HS codes CN 2825300 (vanadium oxides and hydroxides), CN 72029200 (ferro-vanadium) and CN 81129291 (unwrought vanadium; vanadium powders). Import and export data is extracted from Eurostat Comext (2025). Production data is extracted from BGS (2025).
The apparent EU consumption of vanadium at processing stage is presented in Figure 13. Production of vanadium in the EU has been between 600 and 1200 tonnes in 2019-2024.
The import reliance of EU was 84% both for processing stage. (Table 5)
Vanadium is mainly used in the production of high-strength low-alloy (HSLA) steels, special steels, chemicals, stainless steels, superalloys, and energy storage. Figure 14 presents the main uses of vanadium in the world (left) and Figure 15 in the EU (right).
End use sectors in the EU largely mirror those of the global end-uses, however, a significant share of consumption for energy storage applications is concentrated in China. Shares of different end uses in the EU have remained rather stable during the past 10 years [Vanitec,-].
The calculation of economic importance is based on the use of the NACE 2-digit codes and the value added at factor cost for the identified sectors. The value-added data corresponds to 2022 figures, unless indicated otherwise (Table 7). Figure 16 presents value added per 2-digit NACE sector over time.
| Applications | 2-digit NACE sector | Value added of NACE 2 sector | 4-digit CPA |
|---|---|---|---|
| High-strength low-alloy steels | C24 - Manufacture of basic metals | 74,046M€ | C24 - Manufacture of basic metals |
| Special steel | C30 - Manufacture of other transport equipment | 75,800M€ | C30 - Manufacture of other transport equipment |
| Chemicals and battery oxides | C20 - Manufacture of chemicals and chemical products | 146,000M€ | C20 - Manufacture of chemicals and chemical products |
| Stainless steel | C24 - Manufacture of basic metals | 74,046M€ | C24 - Manufacture of basic metals |
| Energy storage | C27 - Manufacture of electrical equipment | 125,000M€ | C27 - Manufacture of electrical equipment |
| Super alloys for high-end uses | C24 - Manufacture of basic metals | 74,046M€ | C24 - Manufacture of basic metals |
The current key demand drivers are the need for lighter weight and higher strength steels. Vanadium itself is soft in its pure form, but when it is alloyed with other metals such as iron, it hardens and strengthens them significantly. Furthermore, vanadium also inhibits corrosion and oxidation of the steels. Consequently, vanadium is used extensively to make alloys (mostly steel alloys) for tools and construction purposes. In fact, most of the vanadium produced (about 80%) is used as ferrovanadium or as an additive in HSLA steels.
However, vanadium finds substantial use in electrochemical applications as catalysts or in energy storage. The latter market has the potential to become a major consumer of material, as vanadium redox flow batteries facilitate the broader integration of renewable power sources such as wind and solar into the electrical grid.
Vanadium is a key microalloying element in HSLA steels, where it enhances strength, toughness, and weldability through precipitation strengthening and grain refinement. End use applications include, for example, structural components, pipelines, and automotive parts requiring high strength and fatigue resistance. [Crowther D. and Li Y.,2022]
In addition to the HSLA mentioned above, vanadium is also alloyed with iron to make medium and high carbon steel, where it has many advantages such as ease of processing and strengthening properties [Glodowski, R. J.,2000]. Vanadium is used also in special steels, for example in steel tools such as axles, crankshafts, etc [Matos et al.,2021].
Vanadium-bearing catalysts are used in hydrocarbon processing to remove nickel and vanadium from the process stream [Goonan Thomas G. ,2011]. Vanadium compounds, in particular vanadium oxide (V2O5), are used as a catalyst in manufacturing sulphuric acid and maleic anhydride and in making ceramics. It is also added to glass to produce green or blue tint. Glass coated with vanadium dioxide (VO2) can block infrared radiation at some specific temperature [Lenntech,2016].
Vanadium is used as an alloying element in some specific stainless steels, such as austenitic stainless steel grades where it improves mechanical strength and high-temperature performance [Wang F. et al. ,2025].
The vanadium redox flow battery (VRFB) is a type of rechargeable flow battery that employs vanadium ions in different oxidation states to store chemical potential energy. Vanadium ions are dissolved in electrolyte in separate tanks and pumped through a central chamber where redox reactions occur, generating electricity [Vanitec,-].
In the last few decades, VRFBs have been studied and developed based on different chemistries [Sánchez-Díez E., E. Ventosa, M. Guarnieri, A. Trovò, C. Flox, R. Marcilla, F. Soavi, P. Mazur, E. Aranzabe, R. Ferret ,2021]. Among them, the most successful is the all-vanadium RFB, which has reached effective commercial fruition starting in the 1980s [Alotto P., Guarnieri, M., Moro F. ,2014]. The Vanitec website provides an overview of vanadium redox flow battery installations worldwide [Vanitec - map,-]. Given their low energy density, when compared with conventional batteries, VRFB are especially suited for large stationary energy storage, where volume and weight are not limiting factors [Cunha A., Martins J., Rodrigues N., Brito F.P. ,2015]. This includes applications such as electrical peak shaving, load levelling, uninterruptible power supply and in conjunction with renewable energies (e.g. wind and solar). VRFB is expected to be the main growth driver for the vanadium demand in medium and long term [Bushveld Minerals,-].
Vanadium-bromine (V-Br) cells and hybrid vanadium-oxygen redox fuel cells (VOFC) are other applications for energy storing for which vanadium is needed, however, both of these concepts are still at a research stage and not commercially deployed.
Vanadium, when combined with titanium, produces a stronger and more stable alloy, and when combined with aluminium in titanium alloys, it produces a material suitable for jet engines and high-speed airframes, while tool steel alloys are used in axles, crankshafts, gears and other critical components. [Lenntech,2016].
Other uses
Other special uses include superconducting magnets, which can be made from vanadium gallium tape, also in the cathodes of batteries for implantable cardioverter defibrillators and to produce smart windows which can lock heat out during the summer and retain heat inside when the weather cools down, saving energy [Australian Vanadium Limited,-].
| Use | Percentage | Substitute | Sub share | Cost | Performance |
|---|---|---|---|---|---|
| High-strength low-alloy steels | 64% | no substitute | 49% | No substitute | |
| High-strength low-alloy steels | 64% | Niobium | 15% | Slightly higher costs (up to 2 times) | Reduced |
| High-strength low-alloy steels | 64% | Tungsten | 8% | Slightly higher costs (up to 2 times) | Similar |
| High-strength low-alloy steels | 64% | Titanium | 8% | Similar or lower costs | Reduced |
| High-strength low-alloy steels | 64% | Molybdenum | 8% | Slightly higher costs (up to 2 times) | Similar |
| High-strength low-alloy steels | 64% | Manganese | 8% | Similar or lower costs | Reduced |
| Special steel | 21% | no substitute | 42% | No substitute | |
| Special steel | 21% | Niobium | 15% | Slightly higher costs (up to 2 times) | Reduced |
| Special steel | 21% | Tantalum | 15% | Very high costs (more than 2 times) | Similar |
| Special steel | 21% | Molybdenum | 8% | Slightly higher costs (up to 2 times) | Similar |
| Special steel | 21% | Manganese | 8% | Similar or lower costs | Reduced |
| Special steel | 21% | Tungsten | 8% | Slightly higher costs (up to 2 times) | Similar |
| Special steel | 21% | Chromium | 4% | Slightly higher costs (up to 2 times) | Reduced |
| Chemicals and battery oxides | 5% | no substitute | 80% | No substitute | |
| Chemicals and battery oxides | 5% | Nickel | 20% | Similar or lower costs | Reduced |
| Stainless steel | 4% | no substitute | 65% | No substitute | |
| Stainless steel | 4% | Niobium | 15% | Slightly higher costs (up to 2 times) | Reduced |
| Stainless steel | 4% | Cobalt | 8% | Slightly higher costs (up to 2 times) | Similar |
| Stainless steel | 4% | Boron | 8% | Similar or lower costs | Reduced |
| Stainless steel | 4% | Chromium | 4% | Similar or lower costs | Reduced |
| Super alloys for high-end uses | 3% | no substitute | 85% | No substitute | |
| Energy storage | 3% | no substitute | 80% | No substitute | |
| Energy storage | 3% | Nickel | 20% | Similar or lower costs | Reduced |
| Super alloys for high-end uses | 3% | Rhenium | 3% | Very high costs (more than 2 times) | Similar |
| Super alloys for high-end uses | 3% | Tantalum | 3% | Very high costs (more than 2 times) | Similar |
| Super alloys for high-end uses | 3% | Zirconium | 3% | Slightly higher costs (up to 2 times) | Similar |
| Super alloys for high-end uses | 3% | Boron | 3% | Similar or lower costs | Reduced |
| Super alloys for high-end uses | 3% | Light Rare Earths | 3% | Very high costs (more than 2 times) | Reduced |
Possible substitutes of vanadium for different uses are presented in Table 8. Substitutes of vanadium for different applications remain the same as in the years 2010-2020. No major change has been identified.
Steels
Substitution of vanadium in all types of steels is basically possible, although limited due to poorer performance of common substitutes in the steels. Steels containing vanadium as an alloying component can be replaced by steels containing various combinations of other alloying elements such as manganese, molybdenum, niobium, titanium, and tungsten, to some extent (USGS, 2025). Niobium can partially substitute vanadium in tool steels, although with limited contribution to the secondary hardness of tool steels during the heat treatment.
Nonetheless, it should be stressed that replacement of V with other elements requires significant technical adjustments of the steel production process to ensure the product quality is not compromised. Therefore, substitution for vanadium is normally not considered for short-term changes in market conditions because of the considerable effort involved in implementing the changes (European Commission, 2017b; USGS, 2017b; USGS, 2017a; Wilmes & Zwick, 2002).
The above substitution options are available for all major uses of ferrovanadium, in tubes and pipes, turbines, automotive parts and building materials. Ferrovanadium used as noble alloy for special steel (FeV80, FeV50) can be substituted partially by ferroniobium. Key factors determining the degree of substitution are the relative price difference between the two FeV and FeNb, as well as the availability of niobium.
Alloys
In special alloys, vanadium is irreplaceable. Currently, there is no acceptable substitute for vanadium in aerospace applications as vanadium-titanium alloys have the best strength-to-weight ratio of any engineered materials (USGS, 2025).
Chemical applications
In catalysts, vanadium can be replaced in some cases by other elements, such as nickel and platinum in several chemical processes (USGS, 2025).
In paints and varnishes, which is a specific part of the chemical applications of vanadium, titanium is a substitute for vanadium use.
Supply
EU consumption of vanadium represented around 14% of the global consumption, which was around 124,000 tonnes in 2025 [Vanitec,2025].
No primary vanadium production is taking place in the EU. According to 2024 trade data, EU imported about 3118 tonnes of vanadium oxides and hydroxides, of which 67 % from Russia. The second main intermediate product was ferrovanadium with a total import of around 2650 tonnes, of which 50 % from South Africa.
EU’s share of the global processing of refined vanadium was 9% in 2020. For the processing of ferrovanadium, EU’s share was 16.1% of the global production. 56% of ferrovanadium was produced in Austria and 44% in Czech Republic. [RMIS,2024c]
The end-of-life recycling input rate for vanadium remain very small (about 1 %, in 2022) [Eurostat,2023].

Figure 17 presents the simplified Sankey diagram for vanadium for the year 2015 in the EU [Matos et al.,2021]. Input to EU vanadium processing came mostly from EU imports of by-products (estimated at about 6.5 kt of V content in 2015, including enriched steel slag, and from refining and burning heavy oils.

In 2015, the importing countries were Austria and Germany, where the vanadium was processed. Secondary vanadium from domestic scrap was a small contributor (0.03 kt of V content in 2015). In this figure, it was considered that there is no import of secondary vanadium in EU for the production of vanadium oxides. Production of vanadium oxides in the EU amounted to 6 kt of V content in 2015, of which only 0.01 kt of V content were exported outside of the EU. Vanadium processing from steel slag and other by products generated about 1.3 kt of V content in waste, disposed in the EU.
Imports of vanadium oxides (about 5.6 kt of V content in 2015) supplemented the input for the manufacturing stage. About 96% of the vanadium oxide supplied to the EU was used for the production of ferrovanadium, an intermediate used in the manufacturing of end products. The EU was a net importer of ferrovanadium, with 1.6 kt of V content supplied in the EU in 2015. Ferrovanadium manufacturing generated about 0.5 kt of V content in waste disposed in the EU.
The overall EU vanadium content (in the form of ferrovanadium or vanadium oxide) supplied in end-products manufactured in the EU was estimated at about 13 kt of V content for 2015, a result consistent with literature sources.
Vanadium is produced through three main routes depending on the source material: primary production, co-production (also referred to as joint production), and secondary production. Primary production from mined ore, vanadiferous titanomagnetite (VTM) and sandstone-hosted vanadium deposits, accounted for about 17% of global vanadium output in 2022 and was largely supplied by a limited number of operations worldwide, notably Largo Resources in Brazil and Bushveld Minerals and Glencore in South Africa [Polyak D. E.,2023] [Tawane G. M., et al,2024] . Although a significant proportion of global vanadium resources occurs in black shale–hosted deposits, only a very small share of vanadium is currently extracted from black shales [Yang L. et al ,2023]. 87% of the global vanadium production in 2022 was produced from vanadiferous titanomagnetite (VTM) [Tawane G. M., et al,2024], a rock containing valuable content of Fe, Ti and V. Extraction of vanadium from high-grade VTM (V2O5>1%) can be achieved by direct extraction process through sodium roasting-water leaching or extracted by direct reduction process. When the vanadium oxide content is less than 1%, the VTM is generally concentrated into vanadium slags (reaching a vanadium content of up to 20%) while co-producing steel [Lindvall Mikael,2017][Gao et al.,2021]. Co-production represents the dominant extraction route and accounted for around 70% of global vanadium production in 2022 [Project Blue,2022]. These operations are widely distributed and exist in several countries, including China, Russia, and South Africa. Secondary production of vanadium is based on the recovery from industrial residues and waste streams, such as vanadium-containing fly ash, petroleum residues, and spent catalysts [Polyak D. E.,2023].
The presence of vanadium in the earth’s crust is moderate, with 97 ppm upper crustal abundance [Rudnick, R.L. and Gao. S. ,2003]; in seawater it is estimated to be about 0.0014 ppm. Among 65 minerals that contain vanadium, the most common vanadium minerals include magnetite (Fe3O4), patronite (VS4), vanadinite [Pb5(VO4)3Cl], and carnotite [K2(UO2)2(VO4)2 3H2O]. Vanadium is present in phosphate, bauxite, titanium, and iron ores. Moreover, it is present in fossil fuel deposits such as oil and coal. The main host mineral of oxidic vanadium ores is vanadium-bearing magnetite, commonly found in gabbro-hosted ore bodies. Typical vanadium grades are 0.7–1.5% in magnetite, meaning concentrations at 0.1–0.2% V (= 0.2–0.4% V2O5) in the ore.
| Country | Resources (tonnes) |
|---|---|
The world resources of vanadium exceed 63 million tonnes [USGS,2025]. Because vanadium is typically recovered as by-product or co-product, for example from iron ores, demonstrated world resources of the element are not fully indicative of available supplies.
| Country | Reserves (million tonnes) |
|---|---|
| Australia | 8.5 |
| Russia | 5 |
| China | 4.1 |
| South Africa | 0.43 |
| Brazil | 0.120 |
| United States | 0.045 |
| Total | 18 |
The world known reserves of vanadium (material content) are about 18 million tonnes [USGS,2025]. Almost 44 % of these reserves are in Australia, 26 % in Russia, and 22 % in China (Table 10).
| Country | Classification | Quantity (Mt of ore) | Grade (% Vanadium ) | Type | Reporting code | Reporting date | Deposit (Reference) |
|---|---|---|---|---|---|---|---|
| Estonia | Inferred | 67,000 | 0.048–0.108 | Shale hosted | Historic | 2018 |
The entire black shale unit (Vind 2018) *methodology is not compliant with the standards |
| Finland | Measured | 64.0 | 0.1404 | Fe-Ti-V | NI43-101 | 09/2020 | Mustavaara closed mine (Seppä & Loven 2020) |
| Indicated | 39.7 |
0.1344 |
|||||
| Inferred | 42.2 | 0.1344 | |||||
| Indicated + inferred | 62.15 | 0.13 | Fe-Ti-V | JORC | 2005 | Koivusaarenneva deposit (Micon 2005) | |
| Inferred | 116.45 | 0.063 | Fe-Ti-V | JORC | 2019 | Koitelainen Vosa deposit (Barry & MacKibben, 2021) | |
| Indicated + inferred | 6.55 | 0.12 | Fe-Ti-V | JORC | 2005 | Kairineva deposit (Micon 2005) | |
| Inferred | 70 | 0.4 | Fe-Ti-V | Historic | 1997 | Koitelainen UC deposit (Mutanen 1997) | |
| Inferred | 334 | 0.06 | Shale hosted | Historic | 1986 | Terrafame nickel mine (Heino 1986) | |
| Inferred | 18.1 | 0.4 | Fe-Ti-V | Historic | 1998 | Akanvaara UC deposit (Mutanen 1998) | |
| Inferred | 20 | 0.34 | Fe-Ti-V | Historic | 1998 | Akanvaara Gabbro deposit (Mutanen 1998) | |
| Inferred | 13.23 | 0.34 | Historic | 2014 | Pyhäjärvi deposit (Cullen 2014) | ||
| Inferred | 14.0 | 0.26x | Fe-Ti-V | Historic | 2015 | Otanmäki closed mine (Otanmäki Mine 2015) | |
| Poland | A+B+C1 | 1076 | 0.18 | Shale hosted | Polish | 2003 | Krzemianka deposit deposit (PGI 2022) |
| C2+D | 263.5 | 0.15 | Shale hosted | Polish | 2003 | Udry? deposit (PGI 2022) | |
| Sweden | Inferred | 44.3 | 0.22 | Fe-Ti-V | JORC | 2022 | Airijoki deposit (Kendrick Resources 2022) |
| Indicated + inferred | 116.9 | 0.22 | Shale hosted | JORC | 2019 | Hörby deposit (Province Resources 2019) | |
| Indicated + inferred: High-grade zone | 124 | 0.24 | Shale hosted | JORC | 2019 | Häggån deposit (Aura Energy 2022) | |
| Indicated | 42 | 0.20 | Shale hosted | JORC | 2018 | ||
| Inferred | 1963 | 0.17 | Shale hosted | JORC | 2018 | ||
| Inferred | 140 | 0.11 | Fe-Ti-V | JORC | 2008 | Routevare deposit (Beowulf 2008) | |
| Inferred | 150 | 0.12 | Fe-Ti-V | Historic | 2010 | Smålands Taberg closed mine (Eilu et al. 2021) | |
| Indicated | 24 | 0.31 (% V2O5) | Shale hosted | 2010 | Viken [Simandl G. J. and Paradis S.,2022] | ||
| Inferred | 2831 | 0.27 (% V2O5) | Shale hosted | 2010 | Viken [Simandl G. J. and Paradis S.,2022] |
Europe has important vanadium resources both of iron-titanium vanadium type in orthomagmatic deposits and black shale deposits containing 0.05–0.2 % of vanadium (0.1–0.4 % V2O5), and steel slag containing up to 3 %. Mining the resources in bedrock has not been economically viable since mid-1980s. The current known vanadium resources in the EU countries are listed in Table 11, with most of the resources located in Finland and Sweden. In addition to Table 11, vanadium-bearing mineralisation is also reported from Norway and Greenland [Jonsson E. et al. ,2023].
Reserves at EU level have not been assessed.
Global mine production of vanadium from mines has increased steadily, reaching a peak of 117,000 tonnes in 2023, followed by a slight decrease to 113,000 tonnes in 2024 (Figure 18, in V content) [World Mining Data,since 1984]. There has not been any mine production of vanadium in Europe after 1985 when the Otanmäki mine in Finland was closed (Mineral Deposit Database of Finland, 2022) [World Mining Data,since 1984]. The main producers of vanadium ores are China, Russia, South Africa, and Brasil. China alone accounted for 69 % of global vanadium supply in 2024 [World Mining Data,since 1984]. Brazil is a recent player on the vanadium market as it started the extraction in 2014 (ibid.).
The recycling of vanadium is generally very low. Two main kinds of secondary vanadium scrap can be discerned: steel scrap, which was recycled along with the vanadium content, and spent chemical process catalysts [Mathieux, F. et al,2017]. Also, certain vanadium-bearing tools can be recycled [Petranikova M. et al.,2020].
| MSA Flow | Value |
|---|---|
|
B.1.1 Production of primary material as main product I EU sent to processing in EU |
0 |
| B.1.2 Production of primary material as by-product in EU sent to processing in EU | 640 |
| C.1.2 Imports to EU of primary material | 6,962 |
| C.1.3 Imports to EU of secondary material | 0 |
| D.1.3 Imports to EU of processed material | 9,236 |
| E.1.6 Products at end of life in the EU collected for treatment | 7,425 |
| F.1.1 Exports from EU of manufactured products at end-of-live | 1,602 |
| F.1.2 Imports to EU of manufactured products at end-of-live | 16 |
| G.1.2 production of secondary material from post-consumer functional recycling in EU sent to processing in EU | 292 |
| G.1.1 production of secondary material from post-consumer functional recycling in EU sent to manufacture in EU | 0 |
Table 13 presents material flows relevant to the EoL-RIR of vanadium (2012-2016).
End-of-life vanadium recycling takes place by the recycling of vanadium-containing steel scraps. The scrap is collected and segregated by material specification.
In addition, typical post-consumer recycling includes spent chemical process catalysts, which are collected and then treated in induction furnace operations. There is some economic activity in the EU specialized in vanadium recycling from spent catalysts. [Moxba,-]
The EoL-RIR of vanadium in the EU in 2022 was 1% [Eurostat,2023].
The collection and handling of vanadium-containing metal scrap is fairly straightforward. Scrap is generated during semi-fabrication and manufacturing operations and consists of items such as clippings, stampings, and turnings. These are usually segregated by material specification and returned to controlled-atmosphere induction furnace operations, where the scrap is matched and melted into a product having the desired chemistry [Goonan Thomas G. ,2011]. Co-producers (via vanadium slag) and primary producers generally are the lowest-cost producers. Those recovering vanadium from fly-ash, uranium and hard coal mining incur the highest cost. This is the reason that the share of secondary sources for vanadium production has dropped in the last years (Lindvall, 2015). Entry barriers for new producers are high, with long development time required to master technology, large capital exposure and market risks.
Secondary vanadium can also be obtained from fossil fuel processing, including mineral oils. Vanadium is present in crude oil from the Caribbean basin, parts of the Middle East, Russia and in tar sands in western Canada. Coal in parts of China and USA contains vanadium as well. During the refining or burning of these energy sources, a vanadium bearing ash, slag, spent catalyst or residue is generated which can be processed for vanadium recovery (Lindvall, 2015).
Such catalysts are as well required for the processing of uranium-vanadium ores, bauxite, phosphate rock and lead vanadates that can contain vanadium. The material recovered (residue) is processed for the metal content, and the spent catalysts are recycled [Goonan Thomas G. ,2011].
The perspectives of vanadium production, at higher amounts, by secondary resources in EU are positive. Currently, Austria is a major vanadium producing centre, where the companies Treibacher Industrie AG and Voestalpine are active. About 46,000 tonnes of various vanadium-containing residues are treated. Treibacher Industrie AG recycles end-of-life catalysts and other residues containing molybdenum, nickel, and vanadium via a pyrometallurgical process by which vanadium is converted into ferrovanadium, at various grades, which is primarily used for making tool steels [Petranikova M. et al.,2020]. Voestalpine has a worldwide leadership in tool steel and a leading position in high-speed steel production.
Minor part of the primary vanadium produced is from direct leaching of vanadium ores, whereas majority is produced as a co-product from steel production. Vanadium-titano-magnetite ores globally constitute the main source for production of vanadium-containing commodities, most importantly vanadium oxides and ferrovanadium (FeV), although other sources are available [Lindvall, M., Tikka, J., Berg, M., Ye G., Sichen, D. ,2017]. FeV is produced from vanadium trioxide (V2O3) or vanadium pentoxide (V2O5).
Extraction of vanadium as co-product to iron is usually done by concentrating the vanadium into a vanadium-slag (Figure below). Production of vanadium-slag involves two main pyro-metallurgical steps. At first, the ore concentrate or direct reduced iron is reduced to a hot metal with a vanadium content of 0.3–0.5 wt %. In the second step, the vanadium in the hot metal is oxidized to the vanadium slag at around 1400 °C. The vanadium slag is an acidic FeO–SiO2 based slag with normally 9–15 wt % of vanadium. The vanadium slag is then converted to vanadium pentoxide by a salt roast and leach process. Vanadium slag is oxidized by oxygen and transformed into water-soluble sodium vanadates in the presence of sodium salts (Na2CO3, NaCl, NaOH and/or Na2SO4). Thereafter, V2O3 or V2O5 is obtained from the leachate by precipitation and calcination [Lindvall, M., Tikka, J., Berg, M., Ye G., Sichen, D. ,2017].

Figure V-slag generation during iron- and steel-making [Lee, J.-C. et al,2021]
The steel company SSAB has 2 Mt of high-grade vanadium-bearing by-product (slag) stored at 3 steel mills in Sweden and Finland. This feedstock has been secured by Critical Metals Ltd (15.4 % NMT) under supply agreement. Location studies for the exploitation of residues containing vanadium are in progress in Luleå and Boden in Sweden, Raahe and Pori in Finland, and Teesside in England. Neometals funds a research project for vanadium recovery using an eco-friendly hydrometallurgical process [Critical Metals,2021]. Figure below presents the location of vanadium-containing residues stockpiles in Sweden and Finland that could be exploited in short term.

Figure Potential secondary vanadium resources in Sweden and Finland [Critical Metals,2021].
Other considerations
Vanadium is a non-volatile metal; thus, most pollution problems are due to airborne vanadium particulates, which can be inhaled, and it settles in the soil and sediments of bodies of water.
Vanadium is toxic to both humans and animals and symptoms of acute poisoning have been extensively reported. However, the pathogenesis of vanadium poisoning still lacks research to be fully understood. The most toxicological forms of vanadium are as follows: vanadium pentoxide (V2O5), sodium metavanadate (NaVO3), sodium orthovanadate (Na3VO4); vanadyl sulfate (VOSO4) and ammonium metavanadate (NH4VO3).
Industrial exposure of workers to vanadium dust (in the form of vanadium pentoxide V2O5) is a well-known occupational hazard. The primary route of human exposure to vanadium pentoxide dust is via inhalation. Absorption of vanadium via oral is thought to be low, less than 1%. The lowest observed adverse effect level (LOAEL) of vanadium for humans is 20 µg m-3 with the appearance of chronic upper respiratory tract symptoms. Symptoms of industrial exposure to vanadium pentoxide are eyes irritation, conjunctivitis, bronchospasm, bronchitis, and asthma related symptoms. The symptoms appear to be acute rather than chronic [Gummow,2011].
Further symptoms of vanadium poisoning that have been reported include weakness, nausea, vomiting, anorexia, tinnitus, headache, dizziness, green discoloration of the tongue, palpitations, transient coronary insufficiency, bradycardia with extra systoles, dermatitis, anaemia, leucopoenia, leukocyte granulation, and lowering of cholesterol levels. Furthermore, studies in humans have shown an existing correlation between the vanadium levels in urine and serum and cognitive deficits. When vanadium concentrations reached approximately 14.2 µg l-1 in urine, a reduction in neurobehavioral abilities was detected. Long-term effects of human exposure to vanadium have not been widely studied. Kidney damage can occur right after exposure in both acute and chronic intoxication. The damage includes dystrophic changes in the epithelium of the convoluted tubules and disturbed tubular secretion, and it is irreversible despite the discontinuation of the exposure [Gummow,2011].
Another route of exposure to vanadium is through food intake. Most food have a naturally occurring low concentration of vanadium, showing a higher presence in seafood than in meat. According to the Agency for Toxic Substances and Disease Registry (ATSDR) the average daily ingestion of vanadium from food is 0.01-0.02 mg. Average vanadium concentrations in tap water have been reported to as 0.001 mg/L, which informs an estimated daily intake of approximately 0.002 mg of vanadium for adults. Vanadium is also present in some nutritional supplements and multivitamins, ranging from 0.0004 to 12.5 mg, depending on the serving size recommended by the manufacturer [ATSDR,2015].
Industrial activities are a major source of vanadium emissions to the environment, particularly from oil refineries and power plants that use vanadium-rich fuels such as heavy fuel oil or coal. Overall, human-related atmospheric emissions of vanadium are estimated to exceed those from natural sources, while natural processes remain the dominant contributors of vanadium to soils and water systems. [ATSDR,2015]
Regarding ambient air-quality and workplace standards for vanadium, The World Health Organization (WHO) air-quality guidelines for the time weighted average (TWA) set for vanadium is <1 µg m-3 per day [Gummow,2011].
Trade restrictions for vanadium ores and concentrates are in place in China (licensing requirement) in 2022 [OECD,2024A].
Table 14 lists the countries for which the economic value of exports of niobium, tantalum and vanadium ores and concentrates represents more than 0.1% of the total value of their exports in 2023 [OEC,2025]. It should be noted, however, that this trade code combines niobium, tantalum and vanadium ores and concentrates, and it is not possible to disaggregate the share of economic importance for vanadium alone.
For ferrovanadium and vanadium oxides and hydroxides, the share of economic value of exports of the total exports did not exceed 0.1 % for any of the exporting country.
| Country | Export value (USD) | Share in total exports |
|---|---|---|
| Rwanda | 102353880 | 7,59 % |
| Ethiopia | 24476059 | 0,62 % |
| Democratic Republic of the Congo | 83120519 | 0,40 % |
| Sierra Leone | 4315992 | 0,28 % |
| Mozambique | 31711374 | 0,27 % |
| Republic of the Congo | 25903227 | 0,22 % |
| Nigeria | 123146531 | 0,20 % |
No major social or ethical issues specific to vanadium production have been consistently identified in the literature.
• Vanadium-containing lithium-ion batteries
Vanadium-based cathode materials are being actively investigated as candidates for next-generation lithium-ion and beyond lithium batteries due to their multivalent redox chemistry, which can enable multi-electron reactions and potentially higher energy densities than conventional materials. These include, for example, layered vanadium oxides (e.g. V2O5) [Zhou Y.-Y. et al. ,2021], vanadium phosphates (e.g. Li3V2(PO4)3) [Yang H., et al,2025], and fluorophosphates (e.g. LiVPO4F and related compounds) [Xue X., et al. ,2020]. In addition, vanadium-containing materials are also being explored as anode materials, such as lithium vanadium oxides and vanadium sulfides, although these remain at an early research stage [Liu H., et al.,2020] [Chen X., et al,2019].
• Carbon capture (TRL 2-3)
Vanadium-based materials are being studied for carbon capture, mainly because their oxides and related compounds can react with CO2. Recent research shows that some vanadium compounds, such as vanadium peroxides, can capture CO2 directly from air by forming carbonates, although this work is still at an early stage. [Ribo E. G. et al. ,2024]
• Vanadium alloys for fusion reactors
Vanadium alloys are being studied as potential structural materials for fusion reactors, especially for blanket components, due to their low activation and good performance under radiation. However, these applications are still under development, with ongoing research needed to improve high-temperature strength and long-term stability. [Muroga T. et al.,2025] [Jiang S.-N. et al. ,2021]
Other research and development efforts focus on improving the sustainable supply of vanadium in Europe, such as the AVANTIS project (2024–2027) which aims to develop low-carbon extraction technologies for vanadium from low-grade deposits and mining wastes, supporting increased domestic supply of critical raw materials in the EU. [AVANTIS,2024]