Overview
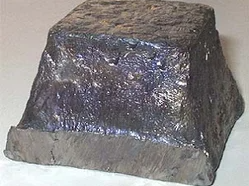
Lead (Pb) is a soft, malleable grey metal with a high density of 11.3 g/cm3, a poor electrical conductivity and a good resistance to corrosion to most acids, including sulphuric and chromic acids. Lead is usually extracted together with zinc, silver and copper. For the purpose of this assessment lead is analysed at both extraction and processing stages.
| Global production | Global producers | EU consumption | EU share | EU suppliers | Import reliance |
|---|---|---|---|---|---|
| 4,699,477t | China 42% Australia 10% Mexico 8% United States 6% Peru 6% Russia 5% India 5% Iran 2% | 224,550t | 5% | Sweden 21% United States 11% North Macedonia? 11% Poland 10% Portugal 7% Bulgaria 7% Greece 5% Mexico 4% Peru 4% Morocco 4% | 19% |
| Global production | Global producers | EU consumption | EU share | EU suppliers | Import reliance |
|---|---|---|---|---|---|
| 14,425,898t | China 50% United States 7% India 7% Korea, South 5% Mexico 3% United Kingdom 2% Germany 2% | 1,406,140t | 10% | Germany 20% Spain 12% Poland 10% Belgium 8% Italy 8% United Kingdom 7% Sweden 5% Bulgaria 4% France 4% Czechia 3% | 6% |
The evolution of lead prices during the period 2000–2024 is depicted in Figure 2. Lead prices are driven primarily by Chinese demand for automotive and traction batteries, power storage devices, and global stock levels. Lead prices increased dramatically between 2002 and 2007, rising from approximately 500 to 1,800 euros per tonne, due to the rapid growth in automotive markets—particularly in China and other emerging economies—which boosted demand for lead. Between 2011 and 2024, prices stabilized around 1,600–1,900 euros per tonne. A temporary peak observed in 2016 was due to concerns over primary supply, following the closure of the Century mine in Australia and the Lisheen mine in Ireland.
Primary lead ore is extracted in approximately 48 countries worldwide (BGS, 2022). The average annual global primary production was around 4.7 Mt during the period 2019–2023 (Table 1), while production at the processing stage over the same period reached 13.97 Mt. Both primary and processed lead production are dominated by China, which accounted for 42% and 49%, respectively. The Fankou Mine in Guangdong is China’s largest lead-producing mine, producing approximately 93.1 thousand tonnes of lead in 2021 [globaldata,2021].
In the Asia-Pacific region, the largest active lead mines are Sindesar Khurd and Zawar in India, along with the Fankou Mine in China. In the Eurasian region, the leading mines include Zhairemsky and Akzhal Zinc-Lead Mines in Kazakhstan and the Kyzyl-Tash Turk Mine in Russia. In Europe, the largest active mines are Garpenberg and Zinkgruvan in Sweden and Sasa Zinc & Lead Mine in North Macedonia [globaldata,2021].
Outside China, significant lead producers include Australia (10.1%), Mexico (8.1%), the United States (5.8%), and Peru (5.7%) (Figure 3). The EU’s demand is largely met by domestic production, with imports accounting for approximately 15%, primarily from the United States, Mexico, and Peru (Figure 3). North Macedonia is classified as a widening country. The EU’s import reliance for lead is low due to substantial domestic production in Sweden, Poland, North Macedonia, Bulgaria, Portugal, and Greece. At the processing stage, import reliance is even smaller (6%) as metallic lead production occurs in several EU countries (Figure 3).
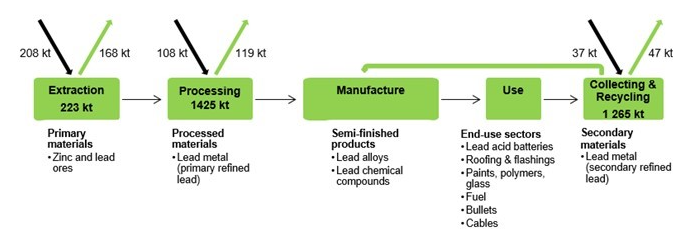
Lead has one of the highest recycling rates of all materials in common use to-date. More refined lead is produced by recycling than from mines. According to the International Lead & Zinc Study Group (ILZSG), the recycling share of global refined lead metal production (i.e., secondary/refined from recycled raw materials) reached 67.5% in 2024 [ilzsg.org,2024]. The recycling rate is more elevated in EU reaching 83% [ilzsg lead,2023].
The major application of lead is in batteries, where it is used as a lead-antimony alloy. There are also a variety of minor applications, including rolled and extruded products, lead compounds, and other types of lead alloys.
| Use | Percentage | Substitute | Sub share | Cost | Performance |
|---|---|---|---|---|---|
| Batteries | 84% | No substitute | 63% | No substitute | |
| Batteries | 84% | Lithium batteries | 35% | Slightly higher costs (up to 2 times) | Similar |
| Batteries | 84% | NiMH | 1% | Very high costs (more than 2 times) | Similar |
| Batteries | 84% | NiCd | 1% | Very high costs (more than 2 times) | Similar |
| Rolled and extruded products | 5% | not assessed, under 10% | 100% | No substitute | |
| Cable sheathing | 4% | not assessed, under 10% | 100% | No substitute | |
| Lead compounds | 3% | not assessed, under 10% | 100% | No substitute | |
| Shot/ammunition | 3% | not assessed, under 10% | 100% | No substitute |
Lead-acid batteries used to be the predominant technology in the automotive industry due to their low cost, reliability across a wide range of climates, and well-established supply chain. Lithium-ion batteries (LIBs) are increasingly replacing lead-acid batteries in many applications; however, they can substitute lead batteries in only about 35% of cases. No substitutes can be identified for several other lead applications, such as rolled and extruded products, lead compounds, and other lead alloys.
Demand for refined lead is forecast to increase by 1.9 percent to 13.39 million tonnes in 2025. The International Lead and Zinc Study Group estimates that global supply of refined lead metal will exceed demand by 121,000 tonnes in 2025 [nasdaq,2025]. A lead CAGR growing by of 6.6% is expected until 2030 [globenewswire,2024]. Concerning a long-term outllok, the demand for lead is expected to significantly reduced after 2060 due to the limitation of acid lead batteries usage [Watari et al.,2021].
Exposure to lead through ingestion or inhalation may result in different types of physiological damages e.g. neurological deficits, risk of anaemia, potential disruption in cell growth and maturation, kidney diseases, damages to fertility or to the unborn child, and carcinogenic [ILO,2023]. Moreover, lead is also very toxic to aquatic life [ECHA (lead),NA]. The main route of exposure to lead in an industrial context is through inhalation of dust/powder particles generated in the working atmosphere (e.g. vapours/fumes occurring during lead metal heating). Lead is generally exploited from sulfidic deposits, which implies a potential risk of acid mine drainage from the generated wastes [ECHA (lead),NA].
Market analysis, trade and prices
| Global production | Global producers | EU consumption | EU share | EU suppliers | Import reliance |
|---|---|---|---|---|---|
| 4,699,477t | China 42% Australia 10% Mexico 8% United States 6% Peru 6% Russia 5% India 5% Iran 2% | 224,550t | 5% | Sweden 21% United States 11% North Macedonia? 11% Poland 10% Portugal 7% Bulgaria 7% Greece 5% Mexico 4% Peru 4% Morocco 4% | 19% |
| Global production | Global producers | EU consumption | EU share | EU suppliers | Import reliance |
|---|---|---|---|---|---|
| 14,425,898t | China 50% United States 7% India 7% Korea, South 5% Mexico 3% United Kingdom 2% Germany 2% | 1,406,140t | 10% | Germany 20% Spain 12% Poland 10% Belgium 8% Italy 8% United Kingdom 7% Sweden 5% Bulgaria 4% France 4% Czechia 3% | 6% |
Production, both primary and at the processing stage, is mainly driven by China, accounting for 42% and 50%, respectively. It should be noted that the EU is also an important lead producer, with major production occurring in Germany, Spain, Poland, Italy, and Belgium. The import reliance of refined lead in the EU is low, not exceeding 6%.
| Mining | Processing/refining | ||
|---|---|---|---|
| CN Code | Title | CN Code | Title |
| 26070000 | Lead ores and concentrates | 28241000 | Lead monoxide 'litharge, massicot' |
| 28332960 | Sulphates of lead | ||
| 78011000 | Unwrought lead, refined | ||
The CN code 26070000 is reffered to the lead ores and concentrates. CN codes 28241000, 28332960 and 78011000 are reffered to lead monoxide or 'litharge or massicot', sulphates of lead and unwrought and refined lead, respectively (Table 6).
The trade flows of unwrought and refined flux lead materials in the EU during the period 2000–2024 are presented in Figure 5. Overall, imports generally exceeded exports, except during the periods 2009–2015 and 2021. The gap between imported and exported quantities was substantial in 2023 (248 kt and 52 kt, respectively); however, a narrowing of this gap was observed in 2024 (164 kt and 113 kt, respectively). The United Kingdom was the major import partner in 2023 (95 kt), followed by Lebanon (26 kt) and China (14.5 kt) (Figure 6).
Lead(II) oxide (PbO) is the most important lead compound. The evolution of EU imports and exports during the period 2000-2024 is shown in Figure 7. Export volumes have remained stable at relatively low levels (around 1,500 tonnes) since 2017, while imports have been negligible.
Figure 9 illustrates the evolution of EU imports and exports of lead ores and concentrates during the period 2000–2024. Both import and export volumes show significant fluctuations, particularly after 2010. The import-to-export ratio was approximately 1 in 2022 (114 kt and 110 kt, respectively). A slight increase in imports was recorded in 2023 (129 kt). In 2024, the United States, North Macedonia, Morocco, Bolivia, and Argentina were the main import partners, contributing approximately 29%, 25%, 10%, 7%, and 7% of total imports, respectively (Figure 10). Imports from North Macedonia, a non-EU European country, have remained consistently high since 2025.
The EU trade flows of lead(II) sulfate (PbSO4) during the period 2007–2024 are shown in Figure 11. Since 2008, both import and export volumes have remained negligible, at approximately 700 tonnes and 200 tonnes, respectively. Turkey and Norway were the most significant import partners (Figure 12).
Lead prices have traditionally been determined by the London Metal Exchange (LME). In recent years, the price of lead has been primarily influenced by Chinese demand for automotive and traction batteries, power storage systems, and global stock levels. Additionally, factors such as overall demand outlook, competing technologies, and health-related concerns can also impact price trends. Average annual prices from 2012 to 2014, which were slightly above USD 2,000 per tonne, declined in 2015 amid weak demand. Prices rebounded in 2016, driven by concerns over primary supply following the closure of the Century mine in Australia and the Lisheen mine in Ireland. After peaking at USD 2,682 per tonne in February 2018, lead prices lost approximately 25% of their value over the course of that year as market supply improved. Despite declining automotive sales and a general slowdown in the manufacturing sector, lead prices remained relatively resilient in 2019. This stability was largely supported by production disruptions at Australia’s Port Pirie smelter and at mines such as Peñasquito in Mexico and San Cristóbal in Bolivia [fastmarkets,2019].The COVID-19 lockdowns and containment measures negatively affected lead prices during the first half of 2020. However, prices rebounded in the second half of the year as demand strengthened and supply concerns intensified due to mine production disruptions, particularly in South America. Lead prices continued to perform strongly at the beginning of 2021, recovering from the uncertainty caused by the pandemic [Barrera, P.,2022] and have remained very close to the 2,000 USD/t threshold in 2023 and 2024.
The lead market is projected to register a compound annual growth rate (CAGR) of over 5% during the period 2021–2026. As China remains the largest consumer of refined lead, the lockdowns implemented in Shanghai in 2022 significantly weakened demand and market sentiment across industrial metals, leading to a decline in prices. The strict COVID-19 containment measures across China further constrained consumer spending and construction activity, severely dampening the demand outlook for lead [Watari et al.,2021]. Nonetheless, the World Bank anticipates that global lead demand will continue to grow in the medium term, supported by steady demand for new and replacement vehicle batteries and the continued use of lead-acid batteries in EVs for auxiliary functions [Worldbank lead,2025].
According to [BMI,2025] the global surplus of refined lead that emerged during the COVID-19 pandemic is expected to narrow in the coming years, with production growth constrained by tightening environmental regulations, particularly in China.
Demand
On a global scale, the demand for refined lead was 13.13 million tonnes in 2024 while the supply exceeded the demand by 63 ktonnes [nasdaq,2025]. Global lead demand is expected to continue to grow in the medium term, supported by steady demand for new and replacement vehicle batteries and the continued use of lead-acid batteries in EVs for auxiliary functions.
Figure 14 presents the EU production, export, import, and demand of primary lead during the period 2000–2024. Primary lead production in the EU remained relatively stable at around 200 kt per year between 2002 and 2023; however, this represents a decrease compared to 2000, when production reached approximately 320 kt. Over the same period, imports and exports of lead concentrates ranged between 100–230 kt and 34–213 kt, respectively. Throughout the entire period, domestic production combined with imports consistently exceeded demand. Today, a production of lead ore is taking place in Sweden, Irland, Poland, Greece, Bulgaria, Romania (data on 2023) reaching about 172 kt totally [ilzsg lead,2023].
A number of lead products (CN 28241000, 28332960 and 78011000) are produced in EU (1.377 mt). According to the moast recent data for the period 2019-2013, the import reliance was around 15%.
According to 2020 data, the production of lead-acid batteries accounts for approximately 80% of global lead consumption. Other significant applications include rolled and extruded products (6%), lead compounds used in various chemical processes (5%), shotgun cartridge fabrication (3%), cable sheathing (3%), and alloys and solders (2%) (Figure 16). Similar proportions are observed in the EU market (Figure 17).
The added value of different sectors related to lead applications in the EU is presented in Table 7 and Figure 18. The manufacture of fabricated metal products, excluding machinery and equipment, is the most significant sector, with an estimated market value of 216 million euros. It is followed by the manufacture of chemicals and chemical products, the manufacture of electrical equipment, and the manufacture of basic metals.
| Applications | 2-digit NACE sector | Value added of NACE 2 sector | 4-digit CPA |
|---|---|---|---|
| Batteries | C27 - Manufacture of electrical equipment | 100,100M€ | C27 - Manufacture of electrical equipment |
| Rolled and extruded products | C24 - Manufacture of basic metals | 90,000M€ | C24 - Manufacture of basic metals |
| Cable sheathing | C27 - Manufacture of electrical equipment | 100,100M€ | C27 - Manufacture of electrical equipment |
| Lead compounds | C20 - Manufacture of chemicals and chemical products | 165,880M€ | C20 - Manufacture of chemicals and chemical products |
| Shot/ammunition | C25 - Manufacture of fabricated metal products, except machinery and equipment | 216,840M€ | C25 - Manufacture of fabricated metal products, except machinery and equipment |
The properties that make elemental lead suitable for many applications include its ductility, ease of welding, low melting point, high density, and its ability to absorb gamma and X-radiation. Globally, the largest share of produced lead is consumed in the manufacture of batteries.
The largest application of lead is by far the manufacture of lead-acid batteries, which accounted for approximately 84% of global lead consumption. Lead-antimony alloys (e.g.,1–8 % Sb with small amounts of tin, arsenic, etc.) are widely used for the cast metal grids and terminals in lead-acid storage batteries. Lead-acid technology is widely used for starting, lighting, and ignition (SLI) in conventional internal combustion engine vehicles, as well as for backup power in uninterruptible power supplies (UPS) and grid energy storage. The operation of lead-acid batteries is based on the following overall electrochemical reaction:
PbO2+Pb+2H2SO4=2PbSO4+2H2O
Lead is also used in the manufacture of rolled and extruded products, such as lead sheets and wires. Lead sheets are widely employed in the construction, building, and chemical industries due to their durability, malleability, high density, and corrosion resistance. They are commonly used as flashings to prevent water penetration, for roofing and cladding, and, to a lesser extent, for radiation shielding and sound insulation. In the chemical industry, lead sheets are used to line chemical treatment baths, acid plants, and storage vessels. Lead pipes are employed for the transport of corrosive chemicals in chemical plants and as protective “sleeves” for joining lead-sheathed cables.
Lead-sheathed cables have occupied an important place in the electrical industry, being widely used in various fields due to their outstanding performance. However, with technological advances and changing environmental requirements, these cables gradually left the dominant market. Lead compounds used as stabilizers in PVC have been voluntarily eliminated within the EU under the Vinyl 2010 and VinylPlus commitments of the PVC industry, with sales ceasing in late 2015. Lead-based paints and frits are also being gradually phased out in Europe. However, lead-based paints continue to be widely sold in developing regions and remain in limited use for specific applications—such as artist paints and certain industrial coatings—in other parts of the world [IPEN,2016].
Lead has been used in ammunition for hunting and sports shooting and in fishing tackle for centuries. It is estimated that around 44 000 tonnes of lead are dispersed into the EU environment from these uses each year: 57 % from sports shooting, 32 % from hunting and 11 % from fishing activities [ECHA,2026].
Tin-lead alloys are the most widely used soldering alloys. Soft solders are largely lead-tin alloys with or without antimony, while fusible alloys are various combinations of lead, tin, bismuth, cadmium and other low melting point metals. ead alloys are used as a sheathing material for power cables in the petrochemical industry or undersea and for underground high voltage cables.
Lead-based compounds are still used (in limited contexts) as pigments in coatings and artwork, for example, yellow lead-antimony pigments (“lead & antimony yellow”) for ceramics, glazes and paints, and lead carbonate in restorations and heritage conservation [webexhibits.org,NA].
Apart Pb-Sb alloys in batteries, the following alloys have significant applications:
Lead-tin alloys (e.g., Pb–Sn combinations) are used for soft solders; lead-silver alloys for higher temperature soldering; fusible lead alloys (with tin, bismuth, cadmium) for other specialized castings.
Lead and lead alloys (e.g., chemical lead, antimonial lead) are used to sheath electrical power/communication cables and provide pipe/sheet construction for chemical installations, due to lead’s corrosion resistance and malleability [casti.ca,NA].
| Use | Percentage | Substitute | Sub share | Cost | Performance |
|---|---|---|---|---|---|
| Batteries | 84% | No substitute | 63% | No substitute | |
| Batteries | 84% | Lithium batteries | 35% | Slightly higher costs (up to 2 times) | Similar |
| Batteries | 84% | NiMH | 1% | Very high costs (more than 2 times) | Similar |
| Batteries | 84% | NiCd | 1% | Very high costs (more than 2 times) | Similar |
| Rolled and extruded products | 5% | not assessed, under 10% | 100% | No substitute | |
| Cable sheathing | 4% | not assessed, under 10% | 100% | No substitute | |
| Lead compounds | 3% | not assessed, under 10% | 100% | No substitute | |
| Shot/ammunition | 3% | not assessed, under 10% | 100% | No substitute |
Table 8 presents the potential substitutes of lead by application. As it is revealed, other kind of batteries (Li-ion, NiMH, NiCd) can substitute, in some cases, acid lead batteries, however their cost is 100% higher. Lead can not be substituted when it is applied as rolled and extruded product, for shot/ammunition and for cable sheating.
Lead-acid batteries used to be the predominant technology option in automotive industry, due to their low cost, reliability in a wide range of climates and well-established supply chain. Lithium-ion batteries (LIB) are increasingly replacing lead-acid batteries for many applications. For example, in Germany in 2021, 9 % of the rechargeable batteries put on the market were lead-acid batteries, while LIBs were predominant with almost 83 % [grs-batterien,2021]. Other commercially available systems include nickel-metal hydride (NiMH) and nickel-cadmium (NiCd) batteries.
There are several alternatives to the use of lead in most sheet applications such as galvanized steel, aluminium, copper and non-metallic materials.
Lead based PVC stabilisers can be replaced by calcium-based stabilizers (Ca-Zn and Ca-organic). Lead-based stabilisers have been phased out by the PVC industry and the replacement was completed by the end of 2015. Cost-effective non-leaded pigments, driers and anti-corrosive agents have been available for decades (titanium dioxide, organic and inorganic pigments, zinc phosphate primers etc.).
Shot lead is an alloy of lead, antimony, and tin.
Within the EU, all soldering materials meet European standard's requirements and lead-free solders are compliant with European Directives RoHS and WEEE. Existing exemptions are periodically reviewed. There are several families of tin-based alloys commercially available as lead-free solders which are generally specific to a certain application such as SnAgCu (tin-silver-copper), SnAgCuBi (tin-silver-copper-bismuth), SnIn (tin-indium) alloys etc.
Supply
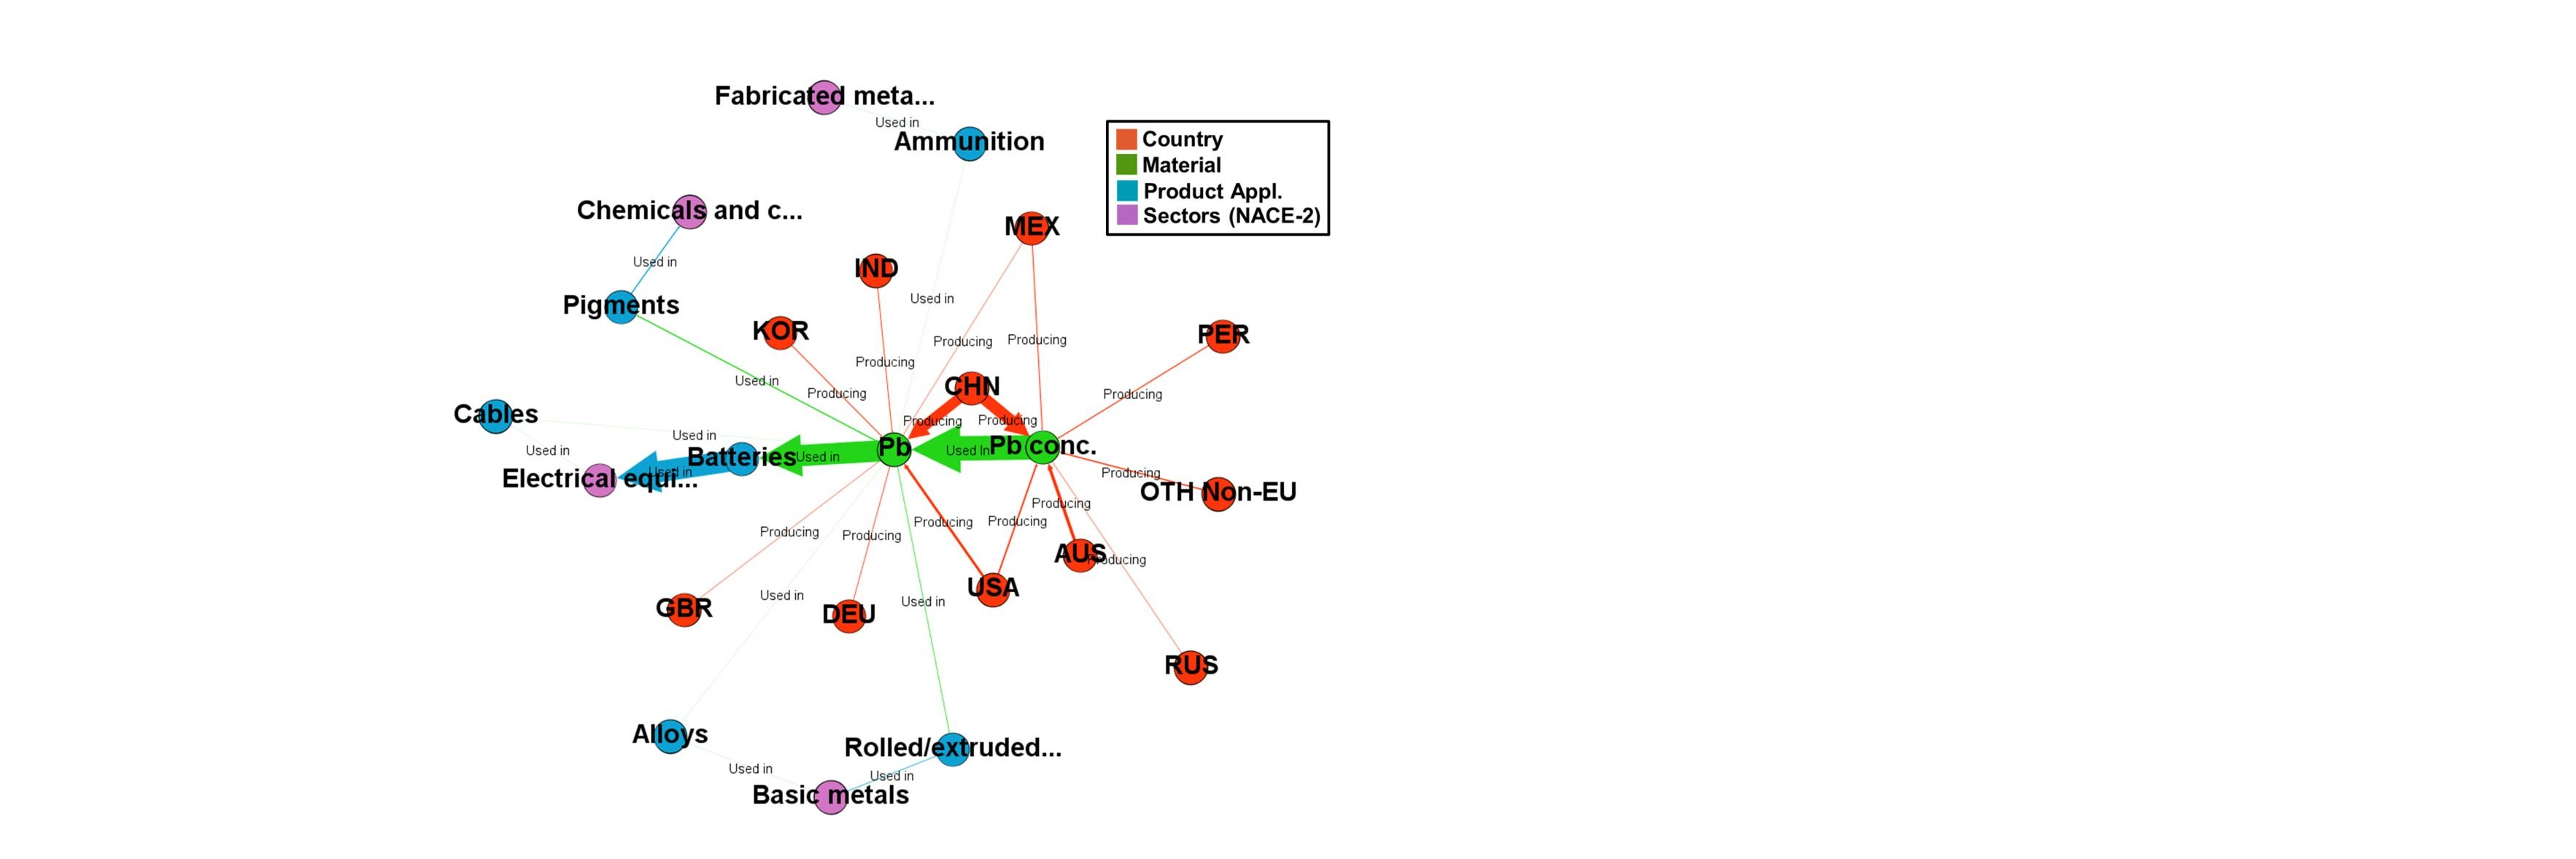
No data are available regarding MSA lead flows in the EU. At the global level, lead concentrate (Pb conc.) is supplied primarily by China (CHN), which also produces the largest share of refined lead (Pb) (Figure 19). Other important producers include Australia (AUS) for lead concentrate and the United States (USA) for both lead concentrate and refined lead. The majority of lead (87%) is used in the production of batteries, which are subsequently employed in the electrical equipment sector. Other significant applications include pigments and rolled or extruded products [Nuss and Ciuta,2018].
The proportion of total output accounted for by primary production is estimated at around 37-38% during the period 2018-2022 [ilzsg lead,2023]. China and Australia dispose the largest reserves of lead ores and are also the largest primary producers of the metal. Canada, US and Peru have smaller but significant amounts of lead ores.

Figure. Primary vs secondary lead production during the period 2005-2022 [ilzsg lead,2023].
Lead concentration in the Earth continental upper crust is estimated to be 17 ppm [Rudnick & Gao,2014] , which is relatively low compared to the other base metals.
Lead is mainly extracted as a zinc co-product from two main types of deposits hosted in sedimentary rocks: sedimentary-exhalative (SEDEX) and Carbonate hosted deposits which include Mississippi-valley type (MVT)
and Irish type carbonate lead zinc deposits. These Pb-Zn deposits which, put together, contain around half of the global resources of lead (Singer, 1995) and dominate world production of lead and zinc. Lead occurs in the form of galena, a sulphide (PbS), in association with sphalerite (ZnS). Silver and barite may also be economically recovered from these deposits. Carbonate replacement deposits (CRD), zinc-lead skarn deposits and volcanogenic massive sulphide deposits (VMS) are also important sources of lead.
SEDEX deposits are hosted in fine grained clastic sediments, mainly shales. Most are large, tabular or stratiform deposits which typically consist of lead and zinc sulphide-rich beds inter-layered with sulphide-poor clastic units. They form from warm brines (100-200C°) discharged on or just below the seafloor, in sedimentary basins in continental rift settings. They include some of the largest lead-zinc deposits in the world, such as McArthur River in Australia and Red Dog in the USA.
MVT deposits are epigenetic stratabound deposits hosted mainly by dolomites and limestones. They form from warm brines with temperatures in the range of 75-200°C (the Irish style tend to have higher temperatures with some data indicating up to 240°C) in carbonate platforms adjacent to cratonic sedimentary basins (e.g. Viburnum trend, USA; Silesia, Poland). The mineralization occurs as replacement of the carbonate rocks and as open-space fill (Paradis et al, 2007; Leach et al., 2010).
Carbonate-replacement deposits (CRD) and zinc-lead skarn deposits (e.g. Groundhog, USA; Bismark, Mexico) are hosted by carbonate rocks (limestones, dolomites, calcareous clastic sediments). They form by reaction of high temperature hydrothermal fluids (>>250°C) with the carbonate rocks, in the vicinity of igneous intrusions. CRD deposits occur as massive lenses, pods, and pipes (mantos or chimneys) ( [Hammarstrom, J.M.,2002] .
Volcanogenic Massive Sulphide Deposits (VMS) are hosted either in volcanic or in sedimentary rocks and occur as lenses of polymetallic massive sulphide. VMS deposits form on, and immediately below the seafloor, by the discharge of a high temperature, hydrothermal fluids in submarine volcanic environments. They also are significant sources for cobalt, tin, selenium, Manganese, cadmium, indium, bismuth, tellurium, gallium, and germanium.
| Country | Resources (tonnes) |
|---|---|
|
|
The identified world lead resources total more than 2 billion tons. In recent years, significant lead resources have been identified in association with zinc and (or) silver or copper deposits in Australia, China, Ireland, Mexico, Peru, Portugal, Russia, and the United States (Alaska) [USGS,2024].
According to the updated USGS data, Australia, China, Russia, Mexico and Peru are the countries with the largests lead reserves. Concerning EU, the largest reserves occur in Sweden (1.7 Mt) corresponding to the 1.8% of the global (95 Mt).
Data for the EU compiled in the European Minerals Yearbook (Minerals4EU, 2019)
|
Country |
Reporting code |
Quantity |
Unit |
Grade |
Code Resource Type |
|
|
Czech Republic |
Nat. rep. code |
0.2 |
Mt |
0.67% |
Potentially economic |
|
|
0.8 |
Mt |
- |
P1 |
|||
|
5.3 |
Mt |
- |
P2 |
|||
|
France |
None |
0.8 |
Mt |
Metal content |
Historic resource estimate |
|
|
Greece |
USGS |
35.3 |
Mt |
4.12% |
Measured |
|
|
Hungary |
Russian Classification |
0 |
Mt |
- |
A |
|
|
0.5 |
Mt |
- |
B |
|||
|
4 |
Mt |
- |
C2 |
|||
|
Ireland |
JORC |
57.4 |
Mt |
1.28% |
Measured, Indicated & Inferred |
|
|
Italy |
None |
0.1 |
Mt |
- |
Sub-economic |
|
|
Poland |
Nat. rep. code |
1.3 |
Mt |
0.08 |
A+B+C1 |
|
|
0 |
Mt |
0.02 |
C2 + D |
|||
|
1.3 |
Mt |
0.07 |
Total |
|||
|
0.6 |
Mt |
1.84 |
A+B+C1 |
|||
|
0.7 |
Mt |
1.78 |
C2 + D |
|||
|
1.3 |
Mt |
1.8 |
Total |
|||
|
Portugal |
NI43-101 |
33.9 |
Mt |
1.40% |
Measured |
|
|
|
112.2 |
Mt |
0.90% |
Indicated |
||
|
|
47.2 |
Mt |
0.64% |
Inferred |
||
|
Slovakia |
None |
0 |
Mt |
1.17% |
Probable (Z2) |
|
|
|
1.6 |
Mt |
1.17% |
Anticipated (Z3) |
||
|
Spain |
NI43-101 |
10.8 |
Mt |
0.01% |
Measured |
|
|
Sweden |
JORC |
0.5 |
Mt |
0.40% |
Measured |
|
|
3 |
Mt |
2.05% |
Indicated |
|||
|
1.5 |
Mt |
1.60% |
Inferred |
|||
|
NI43-101 |
8.5 |
Mt |
4.80% |
Measured |
||
|
6.4 |
Mt |
4.20% |
Indicated |
|||
|
5 |
Mt |
3.20% |
Inferred |
|||
|
FRB- standard |
5.2 |
Mt |
0.91% |
Measured |
||
|
26.2 |
Mt |
1.23% |
Indicated |
|||
|
39.5 |
Mt |
1.26% |
Inferred |
|||
|
United Kingdom |
JORC |
2.1 |
Mt |
2.18% |
Indicated |
|
|
4.1 |
Mt |
1.20% |
Inferred |
Resource data for European countries are available in Minerals4EU (see Table 2). In Poland, the estimated economic resources of Zn–Pb ores (all located in the Silesian–Cracow region) amount to 90.98 million tonnes of ore, yielding 1.43 million tonnes of lead [pgi.gov.pl,2024]. The Pallas Green Project in Ireland represents one of the largest undeveloped zinc–lead deposits in the world. As of 31 December 2018, Glencore Plc reported inferred mineral resources (JORC) of 45.1 million tonnes at a grade of 7% zinc and 1% lead.
A number of new mining projects involving the extraction of lead are planned in EU. They can be referred:
a) The Toral project in Leon, Spain. The reserves have been estimated at 150 kt of lead into a polymetallic Zn-Pb-Ag ore [denariusmetals.com,2025].
b) The Bleiberg Zinc-Lead-Germanium Project in Austria (3 mt of ore with a Pb content 1-2 wt.%) [batteryage.au,NA].
c) The Molai Zn/Pb/Ag/Ge project in Greece (15 mt of ore with a Pb content 1.75 wt.%) [rockfireresources.com,NA].
The evolution of global primary lead production during the period 2000–2024 is presented in Figure 20. World lead production peaked in 2014 at approximately 5.5 Mt, but has slightly declined since 2015 to below 5 Mt. China has been the largest producer globally since 2002, although its production has decreased since 2014. Other important producers include Australia, Mexico, and the United States. It should be noted that no EU country is among the top ten lead producers (Figure 20).
Accordin to the most recent data, in 2024, secondary lead made up ~67.5% of global refined lead output corresponding roughly to 8.8 Mt [ILZSG,2025]. In the EU, secondary (recycled) lead accounts for the majority of refined lead production, with about 83% derived from recycled sources as of 2021 [ilzsg lead,2023]. The primary source of secondary lead is end-of-life lead-acid batteries, which are almost entirely collected and recycled, while smaller contributions come from building and industrial scrap [CRM,2023]. This high recycling rate reduces dependence on imported primary lead and enhances supply security, while also minimizing environmental impacts associated with mining and transport. Despite the dominance of battery scrap, precise tonnage data for recycled lead by source within the EU is limited, though the sector supports a circular economy by maintaining a largely closed-loop lead supply chain [Euro Battery Minerlas,2022].
| MSA Flow | Value | ||
|---|---|---|---|
Lead recovery from acid-lead batteries includes the pretreatment of the waste for the isolation of the lead phase, the smelting in rotary kiln at 950-1100 oC andf the refining-purification of the metal (Figurexxx) [Alonso et al. ,2016].

Figurexxx. Flowsheet of the industrial recycling of lead from acid lead batteries [Alonso et al. ,2016].
Lead-containing slags are the most important solid residues of the lead extractive industry. It has been estimated that the production of 1 tonne of metallic lead generates about 7.1 tonnes of primary slag and up to 350 kg of secondary slag [Niu et al.,2022]. Approximately 5.5 million tonnes of lead slags are accumulated annually [Pan et al.,2019]. Primary slag is produced through the reductive smelting of lead concentrate, while secondary slag is generated during the recycling of spent batteries and the transformation of lead sulfate (PbSO4) and lead oxides (PbO and PbO2) in the recycling process. Lead content in primary and secondary slags ranges from approximately 1–3.5 wt.% and 2–16 wt.%, respectively [Pan et al.,2019]. Despite these notable concentrations, the recovery of lead from slags is techno-economically challenging due to the complexity of the extraction processes and high operating costs. As a result, large-scale commercial recycling of Pb-containing slags has not yet been realized.
The conventional process for smelting lead begins with the removal of sulfur from the concentrates, which is typically achieved through a roasting and sintering process. This converts lead sulfides into lead oxide and transforms most of the sulfur into sulfur dioxide (SO2). The resulting lead oxide (sintered concentrate) is then fed into a blast furnace along with limestone and coke to reduce the oxide to metallic lead. Alternatively, direct smelting systems, such as the Isasmelt furnace, perform roasting, sintering, and smelting in a single step.
The crude lead obtained from the smelting furnace may still contain impurities, including copper, arsenic, antimony, tin, bismuth, zinc, silver, and gold, and therefore requires refining. Stages of purification and recovery of precious metals include “drossing and decopperization” via sulfur addition and the Harris process (addition of molten caustic soda and salt), followed by either a pyrometallurgical method (desilverization through zinc addition, i.e., the Parkes process) or an electrometallurgical method (anode casting followed by fluosilicic acid treatment) (Figure XXXX).

Figurexx. Simplified processes for lead purification and recovery of e.g., gold and silver from galena (PbS) concentrate after smelting [Ferron,2016].
ESG DATA
Primary production of lead suffers by the emission at high amounts of: (a) SO2 and (b) green house gases (GHG) due to the high consuption of coke during the reductive process. Therefore, new direct smelting technologies have been developed by a number of companies that are going replace the conventional roasting/reductive smelting processes. QSL, Kivcet & the Top Submerged Lance (TSL) variants like Isasmelt and Ausmelt can be mentioned as the most significant new more green technologies. GHG emissions could be decreased by the replacement of coal, coke natural gas and fuel oil by hydrogen. Secondary lead industry, based on the recycling of acid lead batteries, generates much lower amounts of SO2 and green house gases, however the environmental management is difficult due to the large number of small (50-100kt capacity) plants world wide, especially in less well developed countries such as India, Mexico and China. The huge number of small capacity plants worldwide mean that consistent alignment to regulations is almost impossible according to the current reality [Skarn Associates,2022].
Other considerations
Lead is primarily associated with significant toxicity hazards. Exposure to lead through ingestion or inhalation can result in a range of physiological damages, including neurological effects (e.g., cognitive deficits), hematological effects (e.g., increased risk of anemia), endocrine disruptions (e.g., interference with cell growth and maturation), renal damage (kidney disease), reproductive toxicity (effects on fertility or the developing fetus), and carcinogenicity. Additionally, lead is highly toxic to aquatic life. Lead and its compounds are listed in REACH Annex XVII, which restricts their marketing and use in certain products and applications. Elemental lead, along with several lead compounds, is also included in the list of Substances of Very High Concern (SVHCs). Certain lead compounds have been added to Annex XIV, which lists substances that cannot be placed on the market or used unless specific uses have been authorized by the European Commission. In industrial contexts, the primary route of exposure to lead is inhalation of dust or fumes generated during processes such as heating lead metal. To minimize risks, the International Labour Organization (ILO) recommends measures to reduce dust formation, such as the use of water sprays, combined with appropriate personal protective equipment (PPE) to safeguard workers from lead exposure [ECHA (lead),NA], [ILO,2023].
Lead is generally exploited from sulfidic deposits, which implies a potential risk of acid mine drainage from the generated wastes .
In an LCA study carried out by the International Lead Association (ILA), the environmental impacts of refined lead production are calculated to amount to 1.31 kg CO2-eq/kg refined lead considering the global warming potential (GWP) impact category. Smelting as well as mining and concentration operations were identified as the main sources of GWP impacts, in particular due to direct on-site emissions resulting from the process and indirect emissions induced by power generation. In terms of primary energy demand, the production of refined lead induces a total consumption of 18.5 MJ/kg refined lead (Davidson et al., 2016) [Davidson,2016].
On a per kilogram basis, lead is one of the metals with the lowest environmental impacts (among 63 metals) considering five impact categories: GWP, cumulative energy demand, terrestrial acidification, freshwater eutrophication, human toxicity. However, it is noteworthy that when considering its global annual production volume (which is significantly high compared to other metals), lead stands among the most impactful metals in particular in terms of global warming potential [Nuss, P. and Eckelman M. J.,2014].
Directive 2011/65/EU (RoHS Directive) restricts the use of cadmium in electrical and electronic equipment (EEE) to a maximum concentration of 0.1 % in each individual homogeneous material of the EEE (RoHS 2011). Equivalently, Directive 2000/65/EC (ELV Directive) restricts the use of cadmium in most vehicles.
Since lead-acid batteries from vehicles and photovoltaic energy generation and storage are a major source of severe environmental and health hazards in low- and middle-income countries, the Basel Convention Secretariat published “Technical Guidelines for the Environmentally Sound Management of Waste Lead-acid Batteries”. (BC 2003) The US-EPA provides information on Lead Policy and Guidance related to lead in air, soil, and water, and in certain products. (EPA 2023)
In the US, Congress has passed several laws related to lead. These laws address lead in paint, dust and soil; lead in the air; lead in water; and disposal of lead waste. EPA is addressing lead contamination and resulting hazards under these laws in many ways, including by issuing and enforcing regulations. EPA also helps the regulated community understand the federal requirements with policy and guidance documents to assist in complying with the regulations (EPA 2023).
While there are no specific indications for storing or transporting/shipping lead, lead ore shall be kept as dry as practicable before loading, during loading and during the voyage [cargohandbook.com (lead),NA].
Lead in North Macedonia is produced at the Sasa Mine, operated by Solway Investments Group. The gross revenue from lead production was approximately €54 million in 2023 (Central Asia Metals, 2023). This amount corresponds to 0.33% of North Macedonia’s GDP (World Bank, 2023), indicating that the economic importance (EI) of lead production in the country is considered high [centralasiametals.com,2024], [WITS (North Macedonia),2024].
| Country | Export value (USD) | Share in total exports |
|---|---|---|
As documented, lead and other toxic elements such as cadmium, mercury, and arsenic are released during the lead refining process. These elements pose a serious environmental threat, as they are transferred—either in particulate or gaseous form—into the soil, water, and air [Raj and Das,2023], [Singh and Li,2014].
The concentrations of toxic trace elements in watercourses seem to have increased recently (data for the period 2015–2020) [Eklof et al.,2024].
The pollution levels are more concerning in case of Eastern Europe [worstpolluted.org,NA].
The European Environment Agency (EEA) proposes restricting the use of lead in specific activities such as fishing (e.g., fishing gear) and hunting [eea.europa.eu,2024], [birdlife.org,2025].
Lead-halide perovskites as new materials for next generation of photovoltaic cells [Ferron, C.J. ,2016] [Ferron,2016]. During the last decade, lead-halide perovskites emerged as promising new material for the next generation of photovoltaic cells and, more in general, optoelectronic, owing to their superior optical absorption coefficients, long carrier diffusion lengths, high defect tolerance, ect. [Jena et al.,2019]. Today, the certified Power Conversion Efficiency (PCE) of laboratory-scale devices based on perovskites solar cells has exceeded 25%. However, the most efficient cells are prepared from perovskites made of lead salts, as PbI2 and PbBr2, soluble in water and thus potentially toxic [Schileo and Grancini,2021]. In addition to lead toxicity, the major obstacle in the way of commercialization is the lack of stability of these devices under real operational conditions, especially for longer duration use [Mazumdar et al.,2021].
HY-NANO: HYbrid NANOstructured multifunctional interaces for stable, efficient, and eco-friendly photovoltaic devices (2019-2024, ERC EU
Nowadays, low-cost three-dimensional (3D) Hybrid Perovskites solar cells are revolutionizing the photovoltaic scene, with stunning power conversion efficiency beyond 22%. However, poor device stability (due to degradation in contact with water) and dependence on toxic components (lead) substantially hamper their commercialization. HY-NANO aims to realize a new low-cost and efficient hybrid solar technology based on Hybrid Perovskites cells combining long-term stability with a reduced environmental impact. Design and engineering innovative multi-dimensional hybrid interfaces is the core idea of the project. In addition, the project aims to the development of new solar cell encapsulant using metal-organic frameworks (MOFs) functionalized as selective lead receptors to minimize the environmental risks associated with the potential release of lead [HYbrid NANO,2019].
Lead recovery from spent acid lead batteries, through the conventional pyrometallurgical route (smelting) causes envrionmental risks such as the production of sulfur dioxide as large amounts and, as well as, the release of lead dust. Aiming to the minimizing of these risks, a number of alternative technologies involving hydrometallurgical, desulfurization and electrolytic stages (Figurexxx), have been designed. However, these technologies have been applied at semi-industrial scale (one kiloton) [Jie et al. ,2022].

Figure. Alternative green metallurgical technologies, applied at semi-industrial scale, for the recovery of lead from acid lead batteries [Jie et al. ,2022].
BeLEADFREE project:- High Strength Bearing for Large-Bore LEAD FREE Engines (2016 – 2018, EU)
Lead (Pb) is a heavy metal very harmful to health and the environment. The large-bore engine industry still heavily relies on lead-based journal bearings. Seven tonnes of lead will be released to the environment from large-bore engines manufactured in 2015. BeLEADFREE aimed to deliver novel lead-free journal bearings to large-bore engine builders worldwide, ranging from medium and heavy-duty diesel engines (e.g. commercial road vehicles) to large four-stroke medium-speed engines (e.g. ships, engine generators or gensets). This will be achieved by optimising novel manufacturing approaches that have proven successful at TRL6 and designing and building a pilot line to manufacture lead-free journal bearings to be validated in real engine working conditions [BeLEADFREE,2016].