Overview
Natural graphite (C, atomic number 6) is a carbon allotrope which exhibits both metallic and non-metallic properties. It is a soft (hardness 1-2 on Mohs scale), grey-black mineral with perfect basal cleavage. It consists of planar sheets formed from three-coordinated carbon atoms. Intra-planar bonding is powerful, but forces holding these sheets together are weak (van der Waals), so the layers can easily slide over each other or expand the space between the layers. Graphite is a good conductor of electricity, it has high thermal resistance and lubricity, is resistant to oxidation, corrosion, chemically inert, not hazardous and nontoxic. These properties make it a raw material with a wide range of uses. The importance of natural graphite is underlined by its special chemical and physical properties, it is irreplaceable for almost all uses, and almost all industrial raw materials, as well various processed products, such as battery anodes are imported into the EU.
| Global production | Global producers | EU consumption | EU share | EU suppliers | Import reliance |
|---|---|---|---|---|---|
| 1,625,414t | China 73% Madagascar 5% India 5% Mozambique 5% Brazil 4% | 95,169t | 6% | China 27% Norway 22% Mozambique 16% Madagascar 14% Brazil 8% Korea, South 4% Ukraine 2% | 100% |
The EU imports almost all the natural graphite for its industry and products, 95,667 tons (average value in 2019-2023). Global production of Graphite was about 1.6 million tons, of which EU demand corresponds to about 6% (Table 1). China is the largest producer with a share of 72% (1 159 107 t). African countries account for 11%, while Brazil and India both for 4%. Mozambique and Madagascar are significant global graphite producers with a share of 6% and 5% respectively. The deposits in Mozambique and Madagascar are known for large graphite flakes.
European imports came mainly from China in years 2019-2023 (on average 25%, 23,917 t). During the same period a significant amount of EU consumption was imported from Norway (22%, 21,047 t), while African countries Mozambique's and Madagascar's share was 29%. Brazil was also a significant EU supplier (9%), instead South Korea's share was about half of this,4%, and Ukraine's 3%. Looking at graphite imports to the EU by continent, the distribution is quite even between Africa (29%), the Middle East (29%) and Europe's own production (25%), all together 83% of the EU's average demand in the years 2019-2023.
According to the graph showing the long-term price variation of natural graphite (Figure 2), the decline has been steady since 2020. The average price of 1,170 EUR/t of 2021-2024 was almost 20% less compared to the period of relatively stable price levels of 2017-2020. The price trend also shows that annual average prices were relatively low also from the year 2000 to 2005 (range 465-597 EUR/t), after which the yearly averages were three times higher until 2008 at around 1,800 EUR/t. Apart from the price drop of the year 2009, the average prices remained at relatively high level until 2016 (moderate annual fluctuations of 1,720-1,960 EUR/t). The price in 2024 1,070 EUR/t was about 45% lower than the top in high prized period of 2010-2016.
The price of natural graphite grades is based on the flake size and purity. The focus of demand is shifting to battery anodes, and this is reflected in the rather low current annual average prices. However, the steel industry's economic cycles have had the strongest impact on graphite prices over the long term, for example a significant downturn in 2022 reduced the prices of both natural graphite (refractory lining bricks) and synthetic graphite (electrodes for electric arc furnaces). Similarly, production cuts, for example mine closures in China for environmental reasons, or mining suspensions in Africa due to oversupply, increase prices. Tariffs have also had a significant impact on the price of natural graphite, for example the sharp price drop in 2017 was due to China's reduction of export tariffs. The United States is imposing a 25% import tariff on Chinese natural graphite [Benchmark,2024B]. The very low import prices of natural graphite favour battery manufacturing in Western countries. Oversupply is likely to keep natural graphite prices low as long as the growing demand for anode graphite is channelled into the use of cheap synthetic graphite. This scenario will slow down the development of domestic mining and anode graphite manufacturing in both Europe and North America. Graphite is among the critical minerals which are in principle exempted from tariffs.
Almost all anode graphite production is currently in China, and this affects the price of natural graphite in the short term (overcapacity keeps prices low). The strong growth in the electrification of transport and the widespread use of energy storage will require more than 5 times the current amount of natural graphite the coming years. Due to the growth in demand, graphite production and the manufacture of anode-finished products will increasingly take place outside of China. This will likely increase average graphite prices in the long term.
The distribution of global producing countries shows in Figure 3 China extracted an average of 1,166,600 tons of natural graphite in 2019-2023 (72% of the global production of 1,609,871 tons). Other major producing countries include Mozambique, Madagascar and Brazil. For example, Mozambique's 102,310 tons covered 96.8% of the whole EU demand in the corresponding period. During the period, quite high production volumes were also recorded in North Korea 32,000 tons and Turkey 21,844 tons, while natural graphite from mines of the Rest of the World 67,594 tons counted 4.2% of all Global production. The three largest producers, China, Mozambique and Brazil covered for almost 85% of all the natural graphite production in 2019-2023.
The EU imported the majority of its natural graphite from China in 2019-2023, on average 25%. The five largest producers accounted for 85% of EU demand: China, Norway, Mozambique, Madagascar and Brazil, totalling around 90,000 tons. Norwegian imports were high, almost the same volume as Chinese imports of around 23,000 tons (22%). African countries have become important in EU's import trade, accounting for almost 30% of demand. Smaller quantities of graphite were imported from South Korea, Ukraine, the United States, Japan and Russia.
Due to its combination of metallic and non-metallic properties, natural graphite is used for a wide variety of applications. At the EU level, the main ones are steel making (66%, refractories and iron castings) and other uses in non-metallic mineral products (12%). According to Diagram 4, Batteries account for (8%), as well as friction materials (8%). Natural graphite was also used for lubricants (6%). The share of batteries has grown significantly and currently accounts for 50% of total demand globally and in the EU.
| Use | Percentage | Substitute | Sub share | Cost | Performance |
|---|---|---|---|---|---|
| Refractories | 54% | No substitutes | 100% | No substitute | |
| Refractories | 54% | Graph free refractory materials | 0% | Similar or lower costs | Similar |
| Miscellaneous (other non-metallic mineral products) | 12% | No substitutes | 100% | No substitute | |
| Miscellaneous (iron castings) | 12% | No substitutes | 50% | No substitute | |
| Miscellaneous (iron castings) | 12% | Synthetic graphite | 30% | Very high costs (more than 2 times) | Similar |
| Miscellaneous (iron castings) | 12% | Secondary synthetic graphite from machining shapes | 10% | Similar or lower costs | Similar |
| Miscellaneous (iron castings) | 12% | Calcined petroleum coke | 10% | Similar or lower costs | Similar |
| Friction materials | 8% | No substitutes | 100% | No substitute | |
| Batteries | 8% | Synthetic graphite | 80% | Similar or lower costs | Similar |
| Batteries | 8% | No substitutes | 20% | No substitute | |
| Lubricants | 6% | No substitutes | 75% | No substitute | |
| Lubricants | 6% | Molybdenum disulfide | 25% | Similar or lower costs | Similar |
Synthetic graphite and natural graphite either competing or are complementing each other technically in various applications. They are commonly substituted for each other, or blends containing both types are prepared by manufacturers [Robinson et al., 2017]. When chosen as a substitute this is mostly driven by the relative price and depends on carbon grade and particle size and shape. However, natural graphite cannot be replaced in refractory materials due to its better oxidation resistance and strength. Due to its layered structure, natural graphite is used almost exclusively in lubricants (Table 3). Its layered structure can also be utilized to produce expanded graphite and products.
Typical applications for natural graphite are also release agents, foundry products and refractory materials, brake linings, pencil leads and thermal conductivity additive in cement. Natural graphite is used in advanced metals, like in self-lubricating metal matrix composites (MMCs).
An exceptional combination of properties makes graphite a raw material indispensable in many engineering fields: high electrical conductivity, excellent thermal conductivity, extreme temperature resistance, outstanding corrosion resistance, excellent lubricating and release properties.
The growth of electric mobility, storage for renewables and data centres is keeping the demand for graphite growth. Globally Where governments have been tightening emission regulations and have developed specific economic policies, the demand for battery minerals is continued to strengthen, including the mining and further processing of natural graphite into anode graphite. This is for example the case in China where the Chinese industrial policies fostering electric vehicles drive consumption more than the environmental regulations.
The International Energy Agency (IEA) comes with the remarkable news on the over 30% growth in foreign investments in renewable energy. Wind and solar electricity generation is not stable, and storage requires large battery capacity. As a result, the consumption of graphite will increase substantially. The global graphite industry size reached USD 27.0 Billion in 2024. By 2033, IMARC Group expects the market to reach USD 49.6 Billion, at a projected CAGR of 6.65% during 2025-2033 [IMARC Group, 2025].
Refractory bricks using natural graphite and graphite electrodes from synthetic graphite are an indispensable part of steel manufacturing. The steel industry is one of the most important consumers of graphite, while construction and transportation are the most important applications of steel, and their economic trends have a major impact on the annual demand for graphite. The global construction volume has been high in recent years.
Graphite anodes are being developed to increase the charging potential among LIB (graphite-silica composites). Graphite has proven to be suitable also for the new technology sodium ion battery (SIB) technologies (also potassium ion batteries).
The focus of graphite production and processing is in the Far East. China's exports of natural graphite concentrates have not been without problems after the 2023 export restrictions. African countries have increased their mining production, which has helped to ensure the availability of natural graphite on the market. Graphite production is also starting in the United States of America, Canada and Australia. China dominates the manufacturing of anode graphite used in Li-ion batteries. The growth in demand for graphite through the electrification of transport will be channelled to China in the short term. South Korea is the largest producer of anode-ready graphite outside China. Further processing of graphite is also being initiated elsewhere, like in Australia, Canada, United States and in EU.
Natural graphite is generally not substitutable in many products. In some applications, it is possible to be substituted by artificial graphite, for example in battery anodes. Secondary graphite can be obtained by recycling used refractory bricks. Graphite recovery from such a solid material is available through conventional flotation enrichment. Graphite can also be separated from battery scrap, although the resulting concentrate often contains both natural and synthetic graphite and impurities (metallic elements and compounds). There is only limited potential for use of graphite obtained from side streams, not only because of impurities, but also because it occurs in very fine grain sizes.
Natural graphite is an inert and non-toxic material [Leguérinel, M. and Le Gleuher, M.,2017], it is not subject to restrictions by the REACH regulation [ECHA, 2019]. China is the leading supplier of natural graphite, both to the EU and globally. The level of governance in China is, on average, low, mainly due to the low score in the governance dimension of “voice and accountability” (World Bank 2018). At the same time the Chinese industrial policy is monopolizing and dominating the whole supply chain from graphite in batteries to cars through subsidization and unfair trade policies.
Market analysis, trade and prices
| Global production | Global producers | EU consumption | EU share | EU suppliers | Import reliance |
|---|---|---|---|---|---|
| 1,625,414t | China 73% Madagascar 5% India 5% Mozambique 5% Brazil 4% | 95,169t | 6% | China 27% Norway 22% Mozambique 16% Madagascar 14% Brazil 8% Korea, South 4% Ukraine 2% | 100% |
The market value of natural graphite was 33.83 billion USD in 2024. The graphite market revenue is expected to grow at a CAGR of 5.23% from 2025 to 2032. The market will reach a value of almost 50.86 billion USD by 2032 (a growth of approximately 50%) [Stellar, 2025]. Global production of graphite was about 1.6 million tons (average for 2019-2023), Table 3. The EU imports practically all its natural graphite (95,667 t), accounting for 6% of global production. China is the largest producer with a share of 72% (1,611,590 t), Fig 3. African countries account on average during the same period 2019-2023 for about 11%, while Brazil and India both for about 4%. Mozambique and Madagascar are significant global graphite producers with a share of 6.4% and 5.1% respectively. The deposits in both countries consist of flake graphite.
European imports come mainly from China (25%, 23,917 t) average in years 2019-2023. Norway also imports a significant amount of EU consumption (22%, 21,047 t), Table 3. African countries Mozambique and Madagascar share 29% of EU graphite demand. Brazil is also a significant EU supplier (9%), South Korea share about half of this, 4%, while Ukraine's is 3%. Looking at graphite imports to the EU by continent, the distribution is quite even between Africa (29%), the Middle East (29%) and Europe's own production (25%), together 83% of the EU's average demand in the years 2019-2023.
China is the market leader in the manufacture and export of spheroidal graphite used in battery anodes. China's lead over Western producers is not only in production volume but also in technical expertise [Advanced Energy Technologies, 2025]. Anodic graphite production is starting in other countries as China restricts exports of spheroidized products for battery anodes, for example South Korea developing into a key player in the graphite products market needed for the green transition – importing graphite and exporting it as processed products, like battery anode materials. Top countries to which South Korea exported battery graphite at most were Poland, China, Vietnam and the USA in 2023 [OEC, 2025A].
Geopolitical tensions, industrial policies and technological developments are shaping the market [IEA, 2025]. Increased availability of subsidised, overproduction of synthetic graphite and since October 2023 export restrictions (licencing) on some natural graphite from in China will reduce the use of natural graphite in batteries in Europe relative to synthetic graphite in the short and long-term. The opening of new mines quarries in Western countries and the availability to the European Union are also being slowed down by the fact that the market price of natural graphite is currently lower than the production costs in many industrialized countries. The dominance of China in anode graphite sales as can be seen in the fact that about 93% of Korea’s anode materials, and 90 percent of Japan’s graphite, comes from China [CSIS, 2025]. The importance of natural graphite in battery anodes and other high-tech materials remains and its demand continues to grow strongly. Geographically, African countries will be more significant producers of natural graphite by 2030 [Benchmark, 2025B]. In addition to Mozambique and Madagascar, new graphite deposits have been found in Tanzania, Namibia and Guinea [Mitchell, 2023].
| Mining | |
|---|---|
| CN Code | Title |
| 250410 | Graphite; natural, in powder or in flakes |
| 250490 | Graphite; natural, in other forms, excluding powder or flakes |
Graphite is classified into two main categories (HS codes): Natural graphite powder or in flakes (CN 25041000), and Natural graphite, excluding powder or flakes (CN 25049000). The largest imports in 2024 were of powders and flakes (84,182 tons), which is over 10 times higher than imports of graphite grades other than powders and flakes. Also based on the Figures 5 and 7, it is seen that the EU is a net importer of natural graphite. Exports of powders and flakes (CN 25041000) 6,510 tons accounted only 7.7% of the 84,182 tons of imports in 2024, while exports (2,794 tons) of natural graphite not in the form of flakes (CN 25049000) accounted for around 47.3% of imports (5,905 tons).
There was significant variation in the volume of powder and flake imports between last 10 years from 2014 to 2024. The lowest exports were in 2014 at 4,443 tons and the highest in 2016 at 21,337 tons. According to import figures, the highest annual import was 115,334 tons in 2022 and the lowest was 67,831 tons in 2015, which was only 60% of the highest import volume, and 80% of the 2024 import. During the period 2000-2024, imports of products others than powders and flakes, peaked at 31,939 tons in 2008 (export 449 tons in same year). Imports and exports remained at a fairly constant level for the next 10 years until 2018 (imports around 3,300 tons and exports around 500 tons), after which exports exceeded imports until 2023 (exports of 5,159 tons in 2022 were 10 times larger than imports of 550 tons). In 2023, imports again exceeded exports and were around twice as large as exports in 2024.
China's share of EU imports of graphite powder or flakes in 2024 was 35.8% (30,140 tons). Madagascar graphite entered the EU market with the second largest volume, 17,756 tons. The share of African countries is becoming even more pronounced, when adding Mozambican imports of 15,715 tons, then African countries produce 40% of Europe's natural graphite demand. Figure 6 shows also that Chinese imports have decreased by 43% in a decade, from the value 52,515 tons in 2014 to the present (market share in 2014 as high as 62%, in 2024 36%). During the period 2000-2024 graphite was also imported from Brazil, Ukraine, Norway, Russia, Zimbabwe, United States and United Kingdom into the EU, which accounted according to the figures for 2024 almost a fifth, 18.3% of EU demand, a total of 15,397 tons.
The total volume of natural graphite imports was approximately 84,000 tons in the year 2024. That is almost 25% less than in 2018. Compared to the figures for 2018, only Norway and Madagascar have increased imports to the EU while China, Brazil, Ukraine and Russia have lost their market share. Imports from Mozambique have remained roughly the same at 15,715 tons. It is worth noting that Madagascar produced 17.756 kt for the EU market in 2024, which was about two and a half times more than in 2018, 6.779 kt. The share of other countries has decreased, about 55%, from 11,600 tons in 2018 (10% of total) to 5,174 tons (6%). In 2009, during the global economic recession, almost 70% of the 40,000 tons of low processing degree graphite imports came from China, while Norway, Brazil and other countries accounted for almost 30%.
Looking at long-term trends, China has significantly lost its share in the EU market to the major graphite producing countries in Africa. It is seen in Fig. 6 EU imports of Natural Graphite CN code Graphite; natural, in powder or in flakes (CN 250410) from 2000 to 2024. China's share of imports was 20 decades ago in 2004 73.2%, instead only 35.8% in 2024 (the growth of imports from African countries during this period was almost 40%). According to forecasts, Africa's rapidly growing graphite resources will "fill" most of the EU's, as well as global growth of demand in the short term. For the availability of critical minerals, it is important that it comes from several countries, and the EU should also get its own production started, high exploring potential of high-quality flake graphite occurs in Finland and Sweden as well in other Nordic countries Norway and Greenland. The United States, Canada and Australia have prioritized to increase their own production of critical minerals on a fast schedule, including natural graphite. Its demand is not only increasing in green transition technologies, but graphite is also a strategic mineral for the defence industry, applications include rocket nozzles, radar-absorbent coatings, and giving vehicle armor greater strength, lightness, and heat resistance.
According to Figure 7, EU export trade of graphite, other than powder or flakes has been relatively small in the long run (in years 2000-2018), on average 11.83% of imports tonnages (range 1.41-68.21%). Export volumes ranged from 190 to 784 tons, while imports from 1,149 to 10,633 tons, with a peak of 31,940 tons in the year 2008. In the years 2019-2022, exports were higher than imports, with a peak of about 10 times higher than imports in the year 2022 (export 5,159 tons and import 550 tons). Imports to the EU increased significantly from 2022 to 2023, amounting to 82,401 tons. Exports remained at the same tonnage (4,066 tons) as in previous years (4,1895 in 2021 and 5,159 tons in 2022). Imports of 5,905 tons in the year 2024 was the same level as the average in years 2000-2018, 5,262 (excluding the unusually high tonnage in 2023, 82,401). Exports in the year 2024 (2,794 tons) decreased by about 30% compared to 2023 and were only about 50% of imports.
According to Figure 8, very small quantities of natural graphite other than powders and flakes have been imported into the EU in years 2000-2024. China has been the most significant importer in the review period, averaging 75.8% in 2000-2007 (max 89.1% in 2002), instead share of imports was slightly lower in 2009-2018, averaging 50.9%. There was a gentle increase in 2019-2022 (average share of total imports 56.7%), while. China's graphite imports of other products than powders and flakes in 2024 (3,640 tons), accounted relatively high percentages for 61.7% of total imports (5 905 tons). Looking at the figures for other major producers, Brazil's imports were significant only in 2010 and 2011 (4,155 tons and 2,955 tons, about 40% of total imports), while Madagascar's imports in 2024, 1,898 tons, accounted for 32% of total imports. The rest of the world share was 79.2% of the peak imports 31,940 tons in the year 2008, and 97.0% of the peak imports 82,400 tons in the year 2023.
Natural graphite prices have been driven in a long term by the steel industry and recently by the increasing demand for lithium-ion batteries sector [Brown et al.,2020]; [MINERALInfo,2021]; [NG,2021]. According to OEC (https://oec.world/) graphite is the world’s 1000th most traded product. In 2020, the top exporters of Graphite were China ($290M), United States ($39M), Germany ($30M), Japan ($26.9M), and Brazil ($26.2M). In 2020, the top importers of Graphite were South Korea ($113M), Japan ($96.7M), Germany ($45.4M), United States ($40.3M), and Poland ($24.2M).
The natural graphite market continues to grow due to the electrification of societies and many other applications. Despite the strengthened demand, the price of graphite has fallen significantly in recent years. The export price of 94% C coarse flake graphite has fallen from around 2500 US$/t to around 1000 US$/t in less than 15 years (2011-2025), and for small flake graphite from around 2000 US$/t to around 500 US$/t. The price of coated spheroidal graphite applied in battery anodes has fallen even more dramatically, from around 17,000 US$/t in 2011 to around 7,000 US$/t in 2025. The price of uncoated spheroidal graphite as well used in battery anode has remained stable at around 5,000 US$/t [Wood Mackenzie,2024]. A cheap raw material, if available, improves the competitiveness of the industry using graphite in product manufacturing in the EU, but the low-price level of imported anodes makes it difficult to start up own processing.
The price of natural graphite varies also by country (or continent). The volatility has been highest in China during the eight years statistical period 2018–2026 according to Business Analytiq, 2026, and to some extent also with Latin America and European prices [Business Analytiq, 2026]. Price developments have been most stable in the US and African markets. The most expensive average price in April 2026 was 1870 US$/t in Latin America, while the price in China was 1,770 US$/t. The cheapest cost level is in Africa, where the price for natural graphite was 640 US$/t (three times cheaper than in Latin America). The strongest price volatility over the years 2018-2026 has been for China’s prices, with the highest being 3,110 US$/t and the lowest 1,650 US$/t (standard deviation 526 US$/t of average 2,239 US$/t), while price volatility in the EU has been moderate, with a standard deviation of 139 US$/t (average price 1,634 US$/t), and the same in Latin America, with a variation expressed as a standard deviation of 238 US$/t and an average price of 1,751 US$/t. Instead, price volatility in the USA has been very low at 81 US$/t (average price 1,327 US$/t), as well low in African prices at 69 US$/t (average value 656 US$/t). In China prices for natural graphite have decreased continuously by almost 40% from 2022 to 2026, and for African graphite as well by a significant 28% from 2023 to 2025. In the EU and Latin America, prices fell in the early 2020s, by around 18%, while in the USA, the price decline shows quite small, by 10% from 2022 to 2025. The price of natural graphite has been falling in China until recently, while in the other economic areas under this review, the price decline stopped during 2025 (prices in this review are from May of each year).
Prices vary significantly even within one year, for example in the first quarter of 2024, Shanghai price for flake graphite (FOB) were 576.33 US$/t (a cautious price increase of 1.41%). In the second quarter of 2024, prices fell significantly to 494.58 US$/t (a decrease of 14.18% compared to the previous quarter). In the third quarter of 2024, prices fell further to 478.11 US$/t (3.33%). In the fourth quarter of 2024, the FOB Shanghai price showed a slight recovery to 483.58 US$/t. In the first half of 2025, the price remained at the same level at 483.65 US$/t. In the third quarter, the price rose by less than 0.95% to 488.24 US$/t [Price Watch,2026] .
Regional graphite prices in December 2025 show that in United States average prices were moderate 856 US$/t compared to lowest prices of China export 542 US$/t and to the highest in Brazil 1963 US$/t. High industrial demand in the US and in Germany keeps prices stable and above Chinese prices (in Germany 814 US$/t). High logistics costs in Brazil and local availability problems are driving up natural graphite prices and keeping them relatively high. Elevated prices in United Kingdom US$ 1452/t reflects import dependence and higher procurement costs [IMARC, 2025] and [IMARC, 2026].
The low and stagnant prices of natural graphite are explained by the weaker than expected demand for batteries, as well as the oversupply of synthetic graphite which already has exceeded the volume of natural graphite in battery anode. Demand for synthetic graphite has increased due to exceptionally cheap manufacturing (both the cheapness of the key raw material, petroleum coke, and the low price of electricity supported by the government), the costs per ton reduced below that of natural graphite during the year 2024 [Benchmark, 2024A]. The sales volumes and price level of natural graphite are also affected by the export restrictions imposed by the Chinese government [Price Watch, 2026] . Natural Graphite prices April 2026 was in North America 1,390 US$/t (unchanged), Europe 1,670 US$/t (0.6% up), Africa 660 US$/t (1.5% up), Northeast Asia US$ 1,780 US$/t (0.6% up) and South America 1,880 US$/t (1.1% up) [Business Analytiq, 2026] .
As a summary excessive supply has driven volatility and prices have been seen to drop quite low, but by 2025 pricing will have stabilized by moving to a demand-led market [IMARC, 2026] . The EU, like other Western economies, is trying to start its own graphite production and battery anode manufacturing. However, China's low export prices for graphite are threatening the implementation of several projects. Country-specific support systems have been prepared both to start new production.
Availability risks are predicted to remain for a long time, as the three largest producing countries China, Madagascar and Mozambique accounted for 92% of the graphite supply in 2023. Correspondingly, the key processing countries China, Japan and South Korea accounted for 98% of the further processing of products. In the IEA forecast [IEA, 2024], the distribution of market shares, in other words the concentration of production, would still be at the same level in 2030, when the share of the three largest in mining would be 88%, and in further processing even higher than today (97%).
By looking at long-term price trends according to Figure 9, the annual average prices of natural graphite were relatively low from the year 2000 to 2005 (range 465–597 EUR/t), after which the average yearly ton prices were quite high until 2008 at around 1,800 EUR/t. Apart from the price drop of the year 2009, the average prices remained at high level until 2016 (moderate annual fluctuations of 1,295–1,960 EUR/t). After this, the annual prices of natural graphite were quite stable until 2020, around 1,239 EUR/t, while since 2021, trade has been carried out at decreasing prices, in 2024 989 EUR/t (USD/t 1,070). The decrease of the average price was 20% compared to the period 2017–2020.
The price of natural graphite grades is affected by the flake size and purity. The focus of demand is shifting to battery anodes (raw material is cheap, fine flaky graphite), and this is reflected in the rather low annual average price. A single production unit aims to produce along with anode raw material as much coarse (300–500 µm) and jumbo size (> 500 µm) flakes as possible, the price of which is four to five times higher than battery grade fine flakes. The price of graphite concentrates, including the corresponding synthetic graphite used in the manufacture of battery anodes in China have fallen significantly in recent years, partly due to oversupply and partly due to trade policy reasons. The price of the most common natural graphite, fine grain size 149 micron (applied as a raw material for anode products) was in the end of 2024 around 650 EUR/t.
Natural graphite is refined and processed for various industrial products. The price of these special grades is often significantly higher than the fine-grained concentrate (< 149 µm). The price of expandable graphite is 2,000–10,000 US$/t (depending on quality) and micronized graphite 3,000–4,700 US$/t (5 µm, 99.5 wt.% C).
Demand
Natural graphite occurs geologically as coarse flakes and fine-grained amorphous graphite. Vein graphite from Sri Lanka is highly crystalline, having a purity of 90% or more as high 95%. It can be selectively mined. In a flake graphite production is essential to maximize the amount of large flake removed from the deposit. This means that any processing which will tend to grind or reduce the size of constituent flake must be minimized. The method of a multi-stage grinding and multi-stage flotation is preferred to process flake graphite. Raw ore feeding particle size is typically 300–500 µm, while final product 10–20 µm. Amorphous graphite ore has typically a high grade up to 60–80% carbon. The traditional process is raw graphite ore - crushing - drying - grinding - grading - packaging. Graphite products are commonly tailored for the customers depending on the application for which it is being used. Run of mine graphite occurs in certain flake size and purity. In many cases, the concentrate is only screened to particle sizes for product manufacturing; if necessary, the concentrate can be further ground. Several industrial materials require graphite with a particularly high carbon content, and the purification methods include chemical and/or thermal treatments. Special processing methods include graphite spheroidization and the production of expandable graphite by thermal/chemical treatment.
Flake graphite which is widely used in metallurgy, refractories, aerospace and other industries when purified in carbon composites, electronics industry, friction materials and lubrication. It is advantages in many industrial materials such as powder metallurgy, fuel cell bi-polar plates, coatings, thermal materials, friction moderators, electrically conductive materials, gaskets, rubber compounds, and other advanced polymer systems. Commercial grades are available in purities ranging from 80–99.9% carbon, and sizes from 2–800 microns [Graphite Central, 2025].
Natural amorphous graphite is mainly used in greases, forging lubricants, also as an additive to structural materials and metallic alloys. It is also used as an additive in brake linings, clutch materials, gaskets and in pencil lead. Vein graphite is applied in electrical engineering like electrical motor brushes. It is also used in refractories, ceramics, lubricants, batteries, and steelmaking. Vein graphite has higher thermal and electrical conductivity than other graphite cause of high degree of crystallinity.
Commercial flake graphite is available in three primary sizes for industrial materials of further grinding: -100 mesh, +100 mesh, and +50 mesh. From these three feed stocks most other grades, from +32 mesh coarse flake to 3-micrometer powder, are made. Purity of commercial flake graphite products range from around 80% carbon up to 99+ percent carbon. Flakes which is in the purity range of 80–98% typically represent concentrates which have been beneficiated using only froth floatation while materials above 98% purity has been purified using other methods subsequent to floatation, like chemical and thermal treatments [Asbury Carbons, 2024].
Production in the EU has decreased dramatically in just over a decade. It is also noteworthy that demand has remained more or less at the same level over the same period. According to Figure 10, the production of natural graphite in the EU 25 years ago in 2000 was relatively high 33,442 tons. That was 31.28% of domestic demand, while relatively low 9.44% in the year 2012. After that, in 2013, domestic production fell to 469 tons and was only 208 tons in 2020. The demand for natural graphite in 2000 was 106,915 tons, of which imports accounted for 72.98%, 78,032 tons. Demand was higher than imports until 2012, after which imports have been on average 10% higher than demand. The long-term trend in demand has been a significant decrease (40%) from 2000 to 2020. During the same period, imports remained almost at the same level (only a 7.56% decrease), while domestic production decreased by almost 100% (33,442 tons in 2000, but only 208 tons in 2022). Graphite exports were 4,558 tons in 2000 and 5,027 tons in 2012. This was 7,328 tons less than domestic production. Since 2013, exports have been approximately 2 times larger than domestic production. Graphite imports have increased from 2022 to 2023 by more than 2 times to 154,577 tons. This is explained by an increase in domestic use in the EU (145,424 tons), while exports remained at the same level as in 2022, approximately 9,300 tons). Imports decreased significantly from high level in 2023 to 90,087 tons in 2024, which was at the same level than in year 2021 (90,898 ton) as well of the same order of magnitude than the average of imported tons during years since 2010. The EU's status as a net importer of natural graphite has further strengthened, with exports (9,304 ton) accounted for only 10% of imports in 2024. The EU is completely dependent on graphite imports, as its own production is alarmingly low compared to consumption.
The EU is currently completely dependent on natural graphite imports, as its own production is alarmingly low compared to consumption. Natural graphite has numerous applications in industrial materials and processes. Steel industry is one of the largest users, the electrification of transport and the need for green energy storage have become the most significant users of graphite recently (Li-ion batteries, as well as fuel cells that will become more common in the future as a means of powering cars). Domestic production was 208 tons, only 0.14% of demand of 145,424 tons in 2023. Production has decreased significantly in 20 years, practically almost completely, in 2000 still over 33,000 tons. Of the 2023 imports of 90,087 tons, as high as 93% (84,182 tons) are products of powder or flakes, (HS code CN 250410). The production of flake graphite and various powders by various enrichment processes is based on conventional flotation and screening to different grain sizes. The production of spherical graphite (from fine flaked floated concentrates) used in battery anodes requires special technical know-how (and special equipment), in which China has a decades-long lead compared to Western countries. However, Europe has significant expertise in graphite processing, with five of the most significant players in the graphite industry operating in the EU: AMG (Germany), Grafitbergbau Kaisenberg GmbH (Austria), Imerys S.A. (France), SGL Carbon (Germany) and Mineral Commodities Ltd (Austria).
Natural graphite has traditionally played a significant role in steelmaking in furnace linings. It is an excellent lubricant and is increasingly used in the automotive industry, such as in brake linings, gaskets and clutch materials, also in various seals and fire retardants, and insulation and reinforcements products. Graphite is also used in powder metallurgy products, in several self-lubricating metal parts that require wear resistance, for example camshafts and piston rings. Natural graphite can also be used in new technology salt batteries.
Applications on natural graphite in 2024 show the trend that the highest demand is in batteries, which has surpassed the consumption in the metallurgical industry. Traditionally refractories of steel industry have been the largest market for global production but recently the rapid electrification of transport is seen as high demand for batteries, equally as strong growth in asking of graphite, accounting for more than half of annual natural graphite consumption (52%) in 2024. A high degree of utilization of refractory materials continues (24%), that high rate has remained as China´s steel industry has started using brick-lined furnaces. Other uses in the metal industry include castings/foundries (8%) and as a recarburising additive (2%). Friction products and lubricants both rate 3% of natural graphite demand while graphite shapes (1%) and other applications as much 7%, [ECGA, 2025]. The share of refractories has decreased 43% since 2021, as well relative share has declined quite high percentages in recarburising and graphite shapes (50%), that less in lubricants (25%), foundries (27%) and in other uses (30%). Demand of natural graphite for batteries has more than doubled from the market share 24 % from the year 2021.
When looking at the end use of graphite, according to 2020 statistics (Figure 11), the steel industry accounts for two-thirds of total consumption. The diverse applications in non-metallic materials account for just over 10% of European graphite use. The demand for batteries is the same at 8% as for friction materials such as brake pads and clutches. Lubricants account for 6% of graphite-containing products.
The 2020 statistics show, Table 5. (NACE Statistical Classification) that graphite was used in lubricants, batteries, foundry industry, refractory materials for metal fabrication, other non-metallic mineral products and friction materials worth €615.177 million. The highest usage was in lubricants at 27% (€165.880 million), with other materials accounting for a similar share of 14.0%–16.3% (€86.399 million–€100.100 million).The Statistical Classification of Economic Activities in the European Community (NACE) developed by Eurostat is a standardized framework used to classify economic activities within the European Union (EU). The term NACE comes from the French title: Nomenclature statistique des Activités économiques dans la Communauté Européenne. The classification system is hierarchical, with four levels ranging from broad sectors to specific activities, covering all areas of the economy, https://classification.codes/classifications/industry/nace.
Figure 13 shows the development of value added in key industrial products containing graphite: refractories, iron castings, batteries, lubricants (per NACE sector over time). In the period under review 2011–2022, the growth was most significant in lubricants, 65%. There was also strong growth (53%) in the use of graphite in the foundry industry (the growth was also almost the same as the 57% growth in Germany's GDP, over the same period). In contrast, the growth in the use of graphite in refractory materials in the steel industry was weaker than in the foundry industry, around 40%. Growth in battery manufacturing has been slower than expected, with value added only around 20% over the 10-year monitoring period.
The value of graphite products increased by an average of about 50% from 2011 to 2022. The value of lubricants, at about €165k, was almost 100% higher in 2022 than the value of refractory materials, at €86k.
The coronavirus pandemic has reduced economic activity in the EU, which is reflected in the decline in graphite demand, especially in the foundry industry in year 2020. Demand fell by almost 30% compared to the previous year, while the decline in other products was significantly smaller, around 1% in batteries and 7% in lubricants.
| Applications | 2-digit NACE sector | Value added of NACE 2 sector | 4-digit CPA |
|---|---|---|---|
| Refractories | C23 - Manufacture of other non-metallic mineral products | 90,000M€ | C23 - Manufacture of other non-metallic mineral products |
| Miscellaneous (iron castings) | C24 - Manufacture of basic metals | 74,046M€ | C24 - Manufacture of basic metals |
| Miscellaneous (other non-metallic mineral products) | C23 - Manufacture of other non-metallic mineral products | 90,000M€ | C23 - Manufacture of other non-metallic mineral products |
| Friction materials | C23 - Manufacture of other non-metallic mineral products | 90,000M€ | C23 - Manufacture of other non-metallic mineral products |
| Batteries | C27 - Manufacture of electrical equipment | 125,000M€ | C27 - Manufacture of electrical equipment |
| Lubricants | C20 - Manufacture of chemicals and chemical products | 146,000M€ | C20 - Manufacture of chemicals and chemical products |
Graphite is a non-metallic mineral but has similar properties to metals, as excellent electrical and thermal conductivity. Due to its physical properties and chemical inertness, it has numerous applications described below: refractory materials, crucibles, lubrication, friction material and lithium-ion batteries. Refractory materials are used in smelting furnaces and convector linings, graphite as well as applied in other areas of metallurgy, such as carburisser in steel production, carbon addition metal alloys and in powder metallurgy and in metal forming. Other materials and technologies where versatile properties are utilized include energy storage and fuel cells, gaskets & foils and insulation & components, fire retardants and pencils. Manganese ferrite compounds containing graphite are utilized to collect heavy oil from water. In pencils fine grained graphite is fixed with clay minerals.
The metal industry applies graphite bearing refractories and crucibles, in foundries used in moulds and cores. The most common compositions of graphite containing refractories in blast furnace linings and other equipment requiring heat resistance are MgO-C (MC), Al2O3-MgO-C (AMC) and high alumina Al2O3-C (AC) refractories. Magnesia-carbon (MC) bricks are used in basic and electric arc furnaces, and steel ladles. Carbon specifications for graphite are macrocrystalline flakes with 90-96% C, about 150 µm to 300 µm grain sizes. The carbon content varies depending on the process technology 3-25% C. AMC refractories are used for steel ladle lining. The material has very high chemical and thermodynamic stability. Alumina/carbon ratio and magnesia/silica contents determine the refractories corrosion resistance, i.e., higher corrosion resistance is achieved with higher carbon content and with smallest SiO2 content. The carbon content varies from 2-15% C. High alumina (AC) refractories are composed of corundum, mullite, Al2O3 and graphite. Products are widely used as the lining materials in blast furnaces and electric furnaces. Carbon content is typically over 10%, as high as 20-30% C [DKG, 2025].
Graphite-containing crucibles are used in the production of non-ferrous metals such as gold, silver, aluminium and brass. These contain refractory clays, silicon carbide and 40-50% graphite. Specification for mostly used natural graphite are flaky grains and relatively high carbon content,85-94% [DKG, 2025]. High purity graphite (99.9% C) is used for products with demanding use. Advantages of graphite are high temperature resistance, strong thermal conductivity, good corrosion resistance and long service life. It has strong corrosion resistance on acidic and alkaline solutions. Graphite crucibles are produced using several moulding techniques, including vibration moulding, isostatic pressing, and compression moulding [IQS, 2025].
Foundries use purified, high-carbon flake graphite, 99% C, in the production of high carbon steels and carbon steel. Grain sizes from about 2 mm to 6 mm are preferred. Other requirements include low ash and sulphur content (GritSablare). The thermal expansion of the casting base (the mould) must be low, and it must also be wear-resistant (Semco Carbon). In addition to flake graphite, amorphous graphite is used. Graphite is also used as a lubricant in the casting process, also as an insulation material preventing heat losses [Cocan Graphite,2025].
Graphite has chemical resistance, thermal conductivity and low thermal expansion and it is commonly used to seal industrial pipes and pumps and engine parts in vehicles. In industry, graphite-containing seals are most often used for oil and gas applications, chemical processing plants, and power plants. Graphite gaskets combine excellent chemical resistance with an exceptionally wide temperature range. Graphite foil is an excellent sealing material for high temperature, high pressure transfer of liquids, gasses, steam, chemicals, and corrosives. The purity requirement for graphite ranges 95% to 99.9% C. Other requirements include low sulphur content (1200 ppm maximum) and very low levels of Leachable Chlorides (50 ppm maximum). Typical carbon content in high demand sealing products in 98% minimum. Both flake and amorphous graphite are suitable for gaskets.
Modified, expandable graphite is commonly used for seals. Flexible graphite refers to as a low-density graphitic material that was developed at the end of the 60s and later introduced in a wider range of industrial applications [Solfiti & Berto, 2020]. The commercial flexible graphite is mainly obtained by rolling of exfoliated graphite without any binder and it is usually tailored in foils or sheets with different thicknesses and densities. Coarse graphite flakes, commonly 180-500 microns are preferred in gaskets and foils.
Carbon materials for fire retardants are produced by the chemical treatment of quality flake graphite. Expandable graphite (EG) achieves an increased volume when exposed to rapid, intense heating. Expandable graphite is used in a growing number of flame-retardant applications both as a blowing agent and suppressor for smoke. Expandable graphite is a chemically modified form of natural graphite, an intercalated compound prepared using strong inorganic acids and oxidants (such as KMnO4, K2MnF6, HNO3, and K2Cr2O7). It can effectively protect various materials, such as plastic, rubber, and coatings against fire [Kim et al., 2025].
Flake size for EG materials varies 150 μm to 300 μm, typical carbon content 90-99% C. To achieve to highest carbon content up to 99% C, after flotation and sieving graphite purified by chemical treatment. According to the sulphur content after expansion, expandable graphite is divided into sulphurous expandable graphite (≥ 0.120%) and low sulphur expandable graphite (< 0.120%).
When heat is applied to the material, the graphite expands and swells to create a protective layer on the surface, slowing the spread of the fire. Moreover, by sealing cavities, e.g. by using sleeves containing expandable graphite (for pipeline systems, for instance), the material blocks combustion gases which would otherwise penetrate the material [AMG Graphite, 2025B]. Heating of the treated graphite results in the conversion of the intercalant from a liquid or solid phase to a gas phase. Gas formation results in an increase in the volume of the intercalant by approximately 100 times [Mazela et al., 2020].
Another novel graphite modification, whose manufacturing technology is similar to fire retardants, is graphite oxide (GO). It consists of multiple layers of graphene oxide, with hexagonal carbon structure [Mazela et al., 2020], and is applied in is used in water treatment, conductive coating, solar panels and in semiconductor systems [East Carbon, 2025], while reduced graphite oxide rGO is widely used in various applications such as energy storage and electronics due to its improved electrical conductivity and mechanical strength compared to GO [Nanografi, 2025B ].
Graphite dominates anode materials in Li-ion batteries. It is also common in energy storage systems. Due to its high electrical conductivity, inertness and reversible Li-ion intercalation between the basal planes of the crystal structure, flake graphite is a critical component of primary and rechargeable batteries. Natural graphite is also suitable for the anodes of developing battery technologies, Na- and K-ion batteries. In Li-ion technology, carbon-coated spherical graphite is used, Na-ion batteries require expandable graphite, while in anodes for K-ion batteries can be manufacturer using same the same graphite material as in Li-ion batteries. Graphite represents almost 50% of the materials needed for batteries by weigh, about 70 in pug-in EVs.
Spherical graphite composes of nodules with the particle sizes D50 between 16 and 18 micrometres (μm). The spheroidization is done with special impact mills. The anode material requires also high purity, 99.95% C. Both natural flake and synthetic graphite are applied. The initial requirements for the floated concentrate for spheroidization are a grain size ≤ 150 microns and a C-content of at least 95%. Approximately 400,000 tons of flake graphite are used to produce about 250 000 tons spheroidal graphite (product yield about 60%, the rest fines waste for other uses). The share of natural graphite in the battery anode market is approximately 25% while Synthetic graphite was needed in anodes 720 000 tons in 2023 (75%) [Benchmark, 2025B]. Recently, synthetic graphite is used almost entirely in Li-ion batteries manufactured in China. Considerable overcapacity of China's synthetic graphite has been created in recent years due to the influence of cheap petrochemical raw materials and available electrical energy. China dominates not only natural graphite production (76%), but also downstream markets, controlling 79% of natural graphite anode and 98% of synthetic graphite anode supply globally [INN, 2025].
For instance, fuel cells use even more graphite than lithium-ion batteries, and some expect them to replace combustion engines as a more efficient means of converting fuel to energy. Fuel cells are making their way into the personal electronics sector and even into the utilities sector, where they can be used to provide emergency power to hospitals or turn methane gas into electricity at wastewater plants. Flake graphite is also an essential part of vanadium-redox battery technology in mass energy storages, [E-Power Resources, 2025]. Super thin graphite bipolar plates in fuel cells must be pure and of high quality to improve electrical and thermal conductivity, as well as ensure long-life operation. Technologies require large flake, high-purity graphite. Fine grained graphite is also used as additives and fillers, but this is a relatively small component of fuel cells. Hydrogen-powered vehicles (loaders etc.) have the potential to consume as much graphite as all other uses combined. The global fuel cell market is experiencing rapid growth and is expected to continue to grow at a CAGR of 20.9% through 2025 [Innovation News Network, 2025].
Vanadium-redox battery anode materials (felt) use expandable flake graphite, with nearly 300 tons of graphite required per 1,000 megawatts of storage. Graphite felts of redox-flow batteries must have good electrical conductivity and high chemical resistance.
Graphite is a critical mineral in the friction industry, especially applied as brake and clutch linings. Materials composites also include metals, mineral fibers, sulphides and resins. With its lubricating properties, graphite modulates the braking effect of friction linings and essentially contributes to braking comfort and noise reduction. Graphite acts also as sustaining the heat dissipation after kinetic energy is transformed into thermal energy.
About the technical properties of friction products, the most important is coefficient of friction. It is mostly related to graphite type (flake or amorphous natural, or artificial graphite) and flake size. The lowest friction property is with macrocrystalline natural graphite (coarse and fine flakes), while the highest friction coefficients were measured with amorphous graphite and synthetic graphite. Carbon content of graphite additive in resin bonded brake and clutch linings is 90-92% C for fine particle size graphite, whereas slightly lower 87-90% C for larger flaked graphite. Purity in sintered metal brake linings is high, 96-99.5% C [AMG Graphite, 2025A].
Graphite is also used are wind turbine brake pads and transmission discs for heavy duty applications like tractors and harvesters. Wind turbine brake pads are subjected to heavy loads; the most commonly used technology is based on Fe-Cu-friction material. The graphite filler has an average size of 150 µm, when spherical particles are used, about 30 µm [Kannan et al.,2024].
Graphite is found in greases, as dry lubricants and in self-lubricating mechanical parts. The properties of a graphite-containing lubricant are affected by the type and purity of the graphite. Flake graphite has the best properties for lubrication and is available from either high metamorphic carbon bearing rocks or vein graphite deposits. Due to their high natural lubricity, natural graphite powders are added in the manufacture of high temperature dry lubricants and oil and water dispersions for use under conditions of extreme friction and heat, such as in heavy machinery, seamless tube rolling mills etc.
The use of solid additives in lubrication substances is based on the lamellar structure of the mineral. Graphite lamellae glide easily over each other resulting in low friction. Large flakes perform best on rough surfaces at low speed, finer particles on smoother surfaces and at higher speeds. These materials may be added in the form of dry powder to liquid lubricants to modify or enhance their properties dry lubricants are used to prevent wear of moving parts, for the lubrication of ceramic materials, and when conditions are hot or extreme contact pressures are encountered. High purity is required from graphite, carbon content 96−98% C. The higher the carbon content and the degree of graphitization (high crystalline) the better the lubricity and resistance [ACME, 2025].
Graphite has advantages in self-lubricating materials and has enabled the introduction of new applications. The lubricity properties are based on very strong graphene layers and the weak bonds between them. Material wear is also minimized by the fact that graphite is a soft mineral (Mohs 1-2). The use of graphite has brought special technical progress, for example, in the use of dryer bearings, radial sheet rings for jet turbines, bearings for conveyors in the food and pharmaceutical industries, as well as in piston rings for air compressor manufacturers [METCAR, 2025].
| Use | Percentage | Substitute | Sub share | Cost | Performance |
|---|---|---|---|---|---|
| Refractories | 54% | No substitutes | 100% | No substitute | |
| Refractories | 54% | Graph free refractory materials | 0% | Similar or lower costs | Similar |
| Miscellaneous (other non-metallic mineral products) | 12% | No substitutes | 100% | No substitute | |
| Miscellaneous (iron castings) | 12% | No substitutes | 50% | No substitute | |
| Miscellaneous (iron castings) | 12% | Synthetic graphite | 30% | Very high costs (more than 2 times) | Similar |
| Miscellaneous (iron castings) | 12% | Secondary synthetic graphite from machining shapes | 10% | Similar or lower costs | Similar |
| Miscellaneous (iron castings) | 12% | Calcined petroleum coke | 10% | Similar or lower costs | Similar |
| Friction materials | 8% | No substitutes | 100% | No substitute | |
| Batteries | 8% | Synthetic graphite | 80% | Similar or lower costs | Similar |
| Batteries | 8% | No substitutes | 20% | No substitute | |
| Lubricants | 6% | No substitutes | 75% | No substitute | |
| Lubricants | 6% | Molybdenum disulfide | 25% | Similar or lower costs | Similar |
Synthetic graphite and natural graphite are competing in various applications. They are commonly substituted for each other, or blends containing both types are prepared by manufacturers [Robinson et al., 2017].
Costs: The choice of the substitute is mostly driven by the relative price, carbon grade and particle size and shape. Substitution is also a function of raw material availability and product performance that can be specific to each end use [Roskill, 2015]. Synthetic graphite has a higher density also higher thermal and electric conductivity. It is chemically purer than natural graphite. However, the carbon footprint of artificial graphite is very high, as well is the price (the best grades are over 10 times more expensive than natural graphite). Batteries, refractories and castings dominates the consumption of natural graphite while electrodes, batteries and recarburising that of synthetic product.
Technical: Natural amorphous graphite is the preferred material in a lower grade or lower value applications, or where the use of graphite as a powder is beneficial [Roskill, 2015]. Refractories, foundries, friction products and lubricants are the main applications of amorphous graphite.
Synthetic graphite can be made from calcined petroleum needle coke, a by-product of the petroleum industry, coal tar pitch or other carbon-containing precursors [Asbury Carbons, 2019]. The higher costs associated with the production of synthetic graphite in comparison to natural graphite mining are somewhat offset by the costs of purification to raise natural graphite’s grade [Roskill, 2015] and [Roskill, 2021]. In general, synthetic graphite has an advantage over natural graphite in applications that require the highest carbon grades and the lowest level of impurities, such as batteries and graphite shapes. In practice, batteries use both. Refractories and castings dominate the consumption of natural graphite while electrodes that of synthetic product. In recent years price of synthetic graphite has fallen significantly in recent years due to overproduction in China. The price is very low despite the fact that a significant amount of electricity is required for its production. The low price of artificial graphite has been influenced by both the cheapness of the key raw material, petro coke, and the low price of electricity supported by the government.
Environmental: The carbon footprints of both types of graphite is different and depends on the technologies and energy sources being used. Even lithium-ion batteries will overtake the steel industry as the number one source of demand for natural graphite, currently synthetic graphite is used almost exclusively in batteries made in China.
Sourcing of alternatives: Alternative sources substitutes for graphite in some applications are typically reprocessed production scraps other forms of carbon such as the secondary synthetic graphite recovered from discarded foundry and other carbon-containing materials [Robinson et al., 2017]. For example, broken the electrodes waste from arc furnaces can be milled and is used as carburizer “carbon riser” in the production of ferrous metal products and steel production.
Refractories for steelmaking is one application in which there is no competition by synthetic graphite [Leguérinel and Le Gleuher, 2017]; [Tercero, 2019]. The flaky shape of natural graphite is beneficial to the structure of the final refractory product, whereas the higher porosity of synthetic graphite (10-15% compared to 2-3% for natural graphite) makes it unsuitable for most refractory applications. When synthetic graphite is used in some refractory applications, firing at temperatures approaching 2,000 °C is required to form a dense graphite structure. However, these refractories have low oxidation resistance and cannot be readily exposed to air, water vapor and carbon dioxide at high temperatures. Besides, the cost of processing natural graphite is not as high because the carbon grades (85-99% C) required by refractories can be achieved by basic processing methods [Roskill, 2015]. Natural graphite is also a key ingredient in the casting and foundry industry. It is used as a release agent to prevent the mould from sticking to the metal during casting. In crucible production, graphite can be substituted by silicon carbide, but with lower performance.
Unlike synthetic, natural graphite can has ability to be exfoliated and then pressed into sheets which provides makes it the preferred structure for gaskets [Canada Carbon, 2025]. Fluid sealing materials are made exclusively from natural graphite flake. Natural flake graphite is used in the manufacture of advanced composite materials, such as polymer matrix composites and metal matrix composites, to enhance their mechanical and thermal properties, whereas synthetic graphite is an additive in ceramic products [Keiron Chemicals, 2025].
Fire retardant materials are manufactured utilizing the expandable properties of natural graphite, in particular, in PU foams for flame retardant engine covers and as a flame retardant in seat upholstery for train and aircraft interiors [LUH, 2025].
Li-ion: Both natural and synthetic graphite are used in Li-ion batteries. Natural graphite is traditionally cheaper, while synthetic graphite is favoured by its consistency and high purity. Synthetic graphite enhances the energy density of batteries and extends their lifespan. Li-ion batteries often use blends of natural and synthetic graphite.
Alkaline: Natural graphite serves as an anode material in alkaline batteries [GRAPHEL, 2025]. Graphite types have certain properties, which may be more pronounced in some than others.
Fuel cells: Natural graphite can be exfoliated and then pressed into sheets and for this reason, it is applied in fuel cells [Canada Carbon, 2025].
Spheroidal graphite used in anodes of Li-ion batteries is either manufactured from synthetic or natural graphite. Secondary synthetic graphite from machining graphite components is also an available substitute [USGS, 2019]. The main area of competition between natural and synthetic graphite is currently in anode materials for Li-ion batteries, and some manufacturers even use mixtures of natural and synthetic graphite in the anode. If the price of battery-grade natural graphite increases to parity with the price of synthetic graphite, then increased uptake of synthetic graphite as a substitute in Li-ion batteries can be anticipated [Roskill, 2015]. In terms of anode technology, silicon-graphite chemistries, which enable higher power densities, are expected to become available soon [Bunsen et al., 2019]. Silicon-carbon (Si-C) anodes are currently in commercial use, particularly in high-performance electric vehicles (EVs) and consumer electronics to enhance energy density. Silicon is currently blended with graphite in small amounts (5–10%).
Friction materials: Natural graphite is commonly used as a friction reducing agent due to its relatively low cost, good lubricating properties, thermal stability and low thermal expansion [Pandolfo & Chavez, 2015]. Natural graphite is not substitutable in friction materials such as brake pads and belts, clutches. Synthetic graphite is rarely used in these friction materials.
Natural graphite is a major component in lubricants and greases. It has a more easily sliding layer structure and gives lubricants better properties than synthetic ones. Natural graphite is also used in applications where friction and wear reduction are required, such as in solid lubricants. Unlike natural graphite, the crystalline structure of artificial graphite is not as layered but consists of more amorphous and disordered structures [Keiron Chemicals, 2025].
Natural graphite can be substituted by synthetic graphite under certain conditions. Also, molybdenum disulphide competes with natural graphite as a dry lubricant but is prone to oxidation [USGS, 2019]; [Roskill, 2015].
Supply
The import reliance of the EU for natural graphite is about 97%. At present, there is no production capacity for spherical graphite in the EU. The company (Leading Edge Corp) holding the Woxna mine, Sweden, worked for a graphite processing plant in 2019 which would produce spherical, battery-grade graphite and other forms of processed graphite at the mine site [Leading Edge Materials, 2021]. Moreover, according to announcements made by the owning company (Talga Resources Ltd) of the Vittangi mine development project in Sweden, the concentrate of the mining operation will be refined to a coated lithium-ion battery graphite anode material [Talga, 2024].
However, processing capacity for the refining of natural graphite exists in the EU, for example:
- The Graphite Týn plant in Czechia (AMG group) produces purified, micronized, and expandable natural graphite [AMG Graphite, 2026] based on imported material;
- The Sundsvall plant in Sweden, through a proprietary electro-thermal treatment and purification process, produces purified graphite for recarburisers, melt covers in foundries, friction materials, and polymer additives [Superior Graphite, 2026] and will be closed in 2026.
- The Kaisersberg plant in Austria (Graphitbergbau Kaiserberg) produces micronized graphite, and other refined graphite products such as expandable graphite [Grafitbergbau Kaisersberg, 2025];
- Graphit Kropfmühl (AMG group) operates two plants in Germany to process crude natural graphite and fabricate graphite products such as graphite dispersions, lubricants and graphite parts. Refined natural graphite products include expandable and expanded graphite [AMG Graphite, 2026], [Roskill, 2015] ;
- SGL Carbon produces speciality and downstream graphite products based on processed natural and synthetic graphite such as components made of high-purity fine grain graphite for silicon crystals production, expanded and flexible graphite. Producing sites for graphite materials are located in Germany (Bonn, Limburg, Meitingen), France (Grenoble, Chedde), Spain (Madrid), Italy (Verdello), Poland (Nowy Sacz, Racibórz), [SGL Carbon,2026], [Roskill, 2015] .
- Mersen produce specialties graphite from natural and synthetic graphite, location: France
- Morgan PLC (UK) produce specialties graphite from natural and synthetic graphite, location: UK
- Schunk produce specialties graphite from natural and synthetic graphite, location: Germany, Austria
- In the Netherlands (Maastricht), Asbury Carbons processes carbon black and graphite scraps graphite for end-use products since 2014, e.g. flake graphite with purity up to 99.9% [Asbury Carbons, 2019], [Roskill, 2015] ;
- Sinograf in Poland imports supply natural flake and amorphous graphite for refractories and foundries along with a range of intermediate and downstream products including graphite micro powders, expanded graphite and flexible graphite products etc. [Sinograf, 2026] .
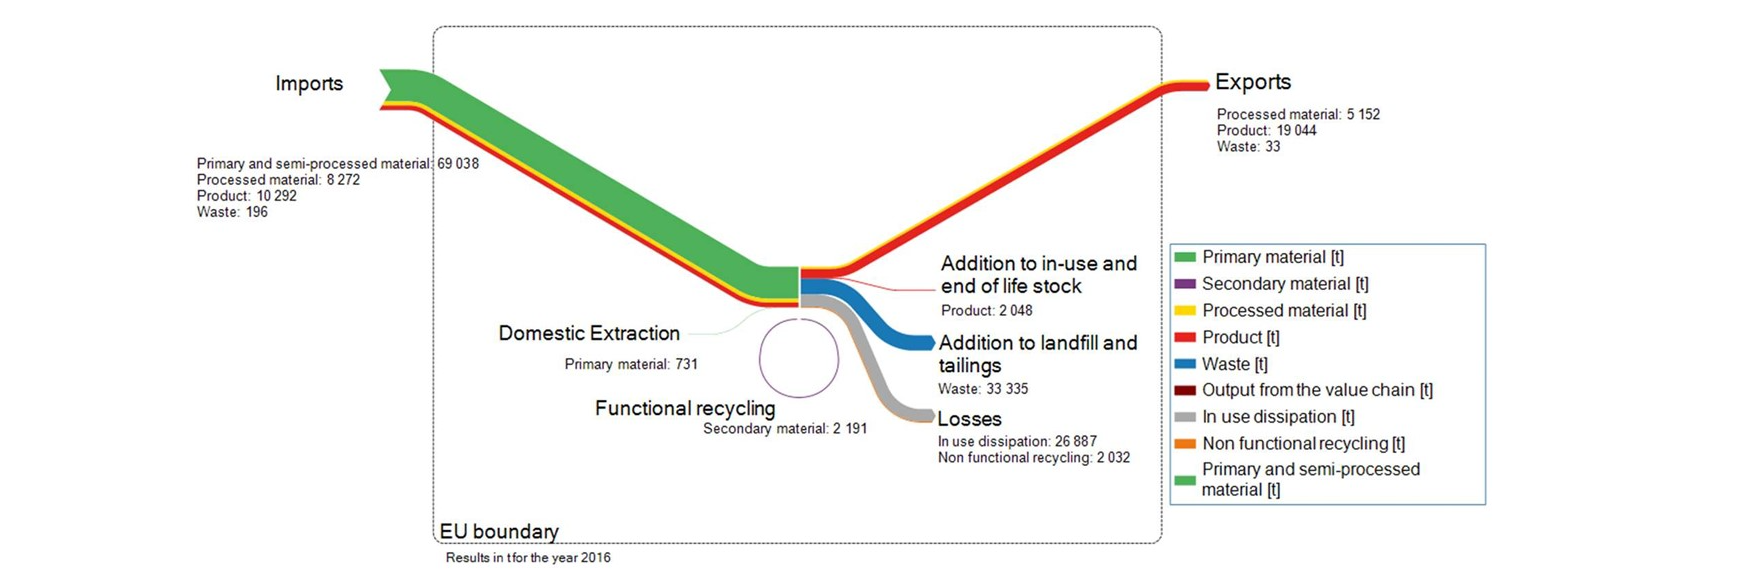
Material system analyses of natural graphite (MSA flows) according to numbers of the year 2016 show imports of 87.8 kt C and exports 24.2 kt C (Fig. 14). Of the imported graphite, concentrates amounted to 69.0 kt C, processed materials 8.3 kt C, products 10.3 kt C and waste graphite 0.2 kt C. Instead of the graphite exports, products were 19.0 kt C and processed materials 5.2 kt C, while processes or other wastes were 33 kt C. Totalling 64.3 kt of graphite remained in the EU internal market, exports accounted for 28% of imports in year 2016 [Matos et al.,2020].
In 2016, the EU's own production (0.731 kt C) was only 0.83% of the imported graphite. Graphite was recovered from secondary materials 2.2 kt C. By calculating own production and functional recycling of imported graphite, a total of 90.7 kt of graphite (C) was utilized for industrial needs in 2016.
MSA flows diagram of the year 2016 shows also that the annual use of natural graphite resulted in 33 kt C of permanent waste in EU, while in use dissipation counted 26.9 kt C. Share of non-functional recycling was about 2.0 kt C, and a corresponding amount of 2.0 kt C classified as addition in-use and end of life stock. Refractory materials (containing around 15% natural flake graphite) have a relatively short life cycle and spent bricks of blast furnace or electric arc furnace linings are generally dumped on landfills, but to some extent refractory wastes are recycled locally in steelmaking, for example in refractory repair compounds and as a carbon additive.
The total demand of natural graphite, 88.5 kt C in 2016 was almost entirely covered by imports of 87.8 kt C (99.2%), graphite was also obtained from a small amount of own production (0.731 kt C), instead to the statistics for 2024, the total demand was at the same level as in 2016, 90.7 kt C. Of this, 90.1 kt C (99.4%) were imported and 0.563 kt C (0.6%) were EU’s own production. Graphite was used quite extensively in various materials in 2024 (more than in 2016), with net demand of 81.3 kt C, while exports were significantly lower at 9.3 kt C (10.3%) compared to material flows in the year 2016.
According to [Matos et al., 2020], in year 2016 62 kt C of finished graphite-containing products were manufactured in the EU, of which 53 kt C remained for the EU's own use (9 kt were exported, summing up with other materials 24.2 kt C). The share of refractory materials in finished products was 46% and batteries 13% (total 59%, 31,270 kt C). Other industrial products included friction materials, lubricants, carbon addition in the steel industry, etc. (41% of finished products) The shares of industrial applications have changed by 2024. Graphite was used mostly in batteries, a significantly higher 52% (42.3 kt C), while share of refractory materials were only 24% (19.5kt C) compared to the year 2016. Two most common uses accounted for 76% of the demand for finished products. Other industrial materials were utilized for 24% (19.5 kt C).
The EU used about 25% (17.0 kt C) more graphite in end products in 2024 than in 2016. Increasing electrification of transport and higher renewable energy storage capacity can be seen in the volume of the utilization of graphite in batteries, which increased by six-fold from 6.9 kt C to 42 kt C between the years 2016 and 2024.
Currently, most of the natural graphite is used in battery electrodes in the EU (over 50%). The average EV battery contains typically 50 to 100 kg of graphite (30% of a lithium-ion battery’s weight)[ECGA, 2025]. Both synthetic and natural graphite are used in the electrodes (typically as anode) but there is no method to separate these two types from each other when recycled. Currently, battery recycling in the EU is very low, with a recycling rate of graphite as low as around 3%.
With an annual demand for graphite growing to 2.5 million tons, 260 kt of recycled graphite would be available annually by 2030. This is around 2.5x the current annual demand of graphite in the EU [Hogue, 2025]. The graphite remains in the so-called black mass residue after other precious compounds have been extracted from the battery waste. The residue, containing organic binder, iron, silicon dioxide, and certain forms of aluminium alongside graphite can be cleaned thermally, chemically and by traditional flotation methods. Although graphite is an indispensable anode (or cathode) component in many battery chemistries, The EU Battery Regulation (EU) 2023/1542 does not mention graphite as a recycling target (https://eur-lex.europa.eu/eli/reg/2023/1542/oj).
Natural graphite occurs in metamorphic rocks, such as marble, schist, and gneiss, and as accumulations in vein deposits. Amorphous deposits compose low metamorphic compact fine-grained graphite. Commercial deposits typically contain more than 1 million tons of ore that is more than 75% carbon. Flake graphite occurrences show well-developed disseminated crystal platelets in pelitic-psammitic and carbonaceous metasediments of predominately Archean to late Proterozoic in age. Flaky, crystalline habitus has formed in amphibolite-facies or higher-grade regional metamorphism. Minable deposits generally contain more than 200,000 tons of ore that grade greater than 8% graphite. Lump or flake is the commercial designation for interlocking aggregates of coarse and highly crystalline graphite crystals that occur as veins or fracture-fillings in igneous and crystalline metamorphic rocks that commonly are of Precambrian age. Deposits are small and challenging to extract, and likely do not exceed 100,000 tons.
No specific information is available for the crustal abundance of natural graphite. The average carbon abundance of the earth’s crust is estimated at 200 ppm distributed between organic compounds, hydrocarbons, coal and mineral forms (diamonds, graphite, carbonate rocks). Natural graphite deposits are generally a result of metamorphism of sedimentary rocks (e.g. marble, schist, and gneiss) rich in carbonaceous material. The ore type is classified as amorphous, flake or vein graphite according to the degree of crystallisation, grain-size, and morphology which are determined by the geologic setting [Robinson et al., 2017]; [BRGM, 2012].
Deposits of amorphous graphite are formed from the metamorphism of highly carbonaceous sediments, usually coal beds. The orebody consists of layers, seams, and lenses, each a few meters thick and hundreds of meters to several kilometres in length. The average commercial ore grade varies from 50 to 90 % carbon, higher than flake graphite; the raw ore and the commodity may contain non-graphitic carbonaceous material in addition to graphite. China and Russia/Ukraine hold the most abundant resources globally. Other deposits are located in the People’s Republic of Korea and Mexico. According to the USGS estimates, approximately half of the total identified resources worldwide are amorphous graphite [Robinson et al., 2017]. Amorphous graphite production accounted for 35% to 40% of the world mine production in 2014 [BRGM, 2016].
Flake graphite is found as disseminated, plate-like particles that crystallised in the carbonaceous metamorphic rock. The body of the ore occurs in tabular form or lenses, as much as 33 m thick and thousands of meters long; the ore grade is low, on average between 5 and 30 % graphitic carbon. Flake graphite deposits in production typically contain 8-12% graphitic carbon and have mineable reserves of 500,000 tons. The most significant flake graphite deposits are located in China, Russia/Ukraine (e.g. the Zavalyevskiy deposit in Ukraine), and Mozambique (e.g. the Balama deposit) where major mine development projects are underway; total resources and reserves in Mozambique amount to 342 million tons in graphite content [S&P Global, 2018]. Important flake graphite deposits also exist in Madagascar, Brazil, India and Canada. In 2014, flake graphite accounted for 60-65 % of world production [BRGM, 2016].
The vein or lump graphite occurs in thin veins in igneous and high-grade metamorphic rocks formed by deposition from high-temperature fluids. Vein graphite deposits are significant for the low level of impurities and the high degree of crystallinity. It is commercially extracted only in underground mines in Sri Lanka with average graphitic carbon in the range 60-95%. Vein graphite global reserves represent only 0.1% of the total, and in 2014 vein graphite accounted for 0.3% of the global natural graphite production.
Graphite is a common mineral in metamorphic rocks throughout Europe. Due to increased exploration, some interesting deposits have been found. The bulk of the graphite occurrences are in Northern Europe and Ukraine, and several amorphous graphite occurrences are also found in Austria. The Trælen deposit in Norway is the world’s richest flake graphite deposit in production with an average ore grade of 31%, and 1,800 kt proven reserves [Gautneb et al., 2019].
| Country | 2022 | % | 2023 | % | 2024 | % |
| United States | ||||||
| Austria | ||||||
|
Brazil |
74 000 000 |
22.9 |
74 000 000 |
28.1 |
74 000 000 | 26.5 % |
|
Canada |
|
0.0 |
5 700 000 |
2.2 |
5 900 000 | 2.1 % |
|
China |
52 000 000 |
16.1 |
78 000 000 |
29.6 |
81 000 000 | 29.0 % |
| Germany | ||||||
|
India |
8 000 000 |
2.5 |
8 600 000 |
3.3 |
8 600 000 | 3.1 % |
|
Korea, North |
2 000 000 |
0.6 |
2 000 000 |
0.8 |
2 000 000 | 0.7 % |
|
Korea, South |
1 800 000 |
0.6 |
1 800 000 |
0.7 |
1 800 000 | 0.6 % |
|
Madagascar |
26 000 000 |
8.0 |
24 000 000 |
9.1 |
27 000 000 | 9.7 % |
| Mexico | 3 100 000 | 1.0 | 3 100 000 | 1.2 | 3 100 000 | 1.1 % |
|
Mozambique |
25 000 000 |
7.7 |
25 000 000 |
9.5 |
25 000 000 | 9.0 % |
|
Norway |
600 000 |
0.2 |
600 000 |
0.2 |
600 000 | 0.2 % |
|
Russia |
14 000 000 |
4.3 |
14 000 000 |
5.3 |
14 000 000 | 5.0 % |
| Sri Lanka | 1 500 000 | 0.5 | 1 500 000 | 0.6 | 1 500 000 | 0.5 % |
|
Tanzania |
18 000 000 |
5.6 |
18 000 000 |
6.8 |
18 000 000 | 6.4 % |
|
Turkey |
90 000 000 |
27.8 |
6 900 000 |
2.6 |
6 900 000 | 2.5 % |
| Ukraine | ||||||
| Uzbekistan | 7 600 00 | 2.3 | - | - | ||
| Vietnam | 9 700 000 | 3.5 % | ||||
|
Sum |
323 600 000 |
100 |
263 200 000 |
100 |
279 099 980 |
100.0 % |
According to the United States Geological Survey (USGS), the world’s inferred resources exceed 800,000 kt of recoverable graphite [USGS, 2021]. China has the largest graphite production and reserves, 2023-2024 data [USGS, 2024]; [USGS, 2025]. It is followed by Brazil, Mozambique, Madagascar, Tanzania and Russia. Shown in Table 7, Brazil's reserves are almost as large as China's. Brazil's graphite deposits are of the flake type, as are those in Canada, African countries and Norway. Most of China's deposits are flake graphite, but deposits of amorphous graphite are also in production. The graphite reserves of Russia, South Korea and North Korea are also flake and amorphous in grain sizes. The occurrences in India are of the flake and lump type. The active mine in Turkey produces amorphous graphite, as well as are the majority of most well studied deposits (including also some flake graphite targets). Sri Lanka has rare vein deposits. These deposits consist of the highest-quality natural graphite, with carbon content often exceeding 90–99%, making it ideal for high-tech applications. Companies like Ceylon Graphite are active in mining these historic, deep-underground deposits.
China has significantly increased its natural graphite reserves from 2022 to 2023, up to 50% [USGS, 2023]. India and North Korea have also increased their resources, although only by 10%. Natural graphite is a critical and strategic mineral in several global economic regions and production is starting and new deposits are being explored in several countries, including the US, Canada, Australia, Greenland, and Zambia, Namibia and Guinea in Africa. The most important global reserves are listed in Table 7. The current largest reserves of graphite according to USGS statistics 2024 are by continent Asia 35.0%, South America 28.6%, Africa 25.9%, North America 2.2% and Europe 8.3%. China and Madagascar have both increased their reserves compared to 2023 by 3 million tons. If the tonne quantity is not stated, then it is included in World total.
| Country | Resources (tonnes) | References |
|---|---|---|
| Australia | 360 000 000 |
https://discoveryalert.com.au/news/australian-graphite-industry-2025-prospects-challenges/, https://invest.sa.gov.au/projects/uley-2-project-graphite, https://www.mining-technology.com/projects/siviour-graphite-project-south-australia/?cf-view, https://lincolnminerals.com.au/projects/kookaburra-gully-graphite/, https://www.internationalgraphite.com.au/operations/springdale/ |
| Austria | 1 600 000 |
https://investingnews.com/daily/resource-investing/battery-metals-investing/graphite-investing/europes-graphite-supply-chain/ |
| Botswana | 6 900 000 | https://nora.nerc.ac.uk/id/eprint/538618/1/Graphite%20in%20Africa%20EIG%202022%20Clive%20Mitchell.pdf |
| Brazil | 360 000 000 | https://p3m.sgb.gov.br/media/estudos_pesquisas_en/graphite_geoeconomic_profile.pdf |
| Canada | 368 010 000 | https://www.northerngraphite.com/ldi/, https://www.mining-technology.com/projects/kearney-graphite-mine-ontario/?cf-view, https://www.canadacarbon.com/newsdetail?newsfile=ccb_20240402.htm, https://mining.com.au/e-power-resources-graphites-next-frontier-quebec-steps-up/, https://www.mining-technology.com/projects/matawinie-graphite-project-quebec/?cf-view, https://nmg.com/pea-uatnan/, https://www.mining-technology.com/projects/bissett-creek-graphite-mine-ontario/, https://www.mining-technology.com/news/northern-graphite-lac-des-iles/?cf-view, https://www.canadacarbon.com/asbury-graphite-project |
| China | 264 530 000 |
https://www.sciencedirect.com/science/article/pii/S0169136817303025 |
| Finland |
26 700 000 |
https://www.grafintec.fi/wp-content/uploads/2024/01/Grafintec-Corporate-Presentation-Jan-2024.pdf |
| Ghana | 14 400 000 | https://nora.nerc.ac.uk/id/eprint/538618/1/Graphite%20in%20Africa%20EIG%202022%20Clive%20Mitchell.pdf |
| Greenland | 23 550 000 | https://www.londonstockexchange.com/news-article/GROC/successful-battery-test-work-with-amitsoq-graphite/16310943, https://data.geus.dk/pure-pdf/32599_GEUS-R_2018_53_opt.pdf |
| Guinea | 19 140 000 | https://nora.nerc.ac.uk/id/eprint/538618/1/Graphite%20in%20Africa%20EIG%202022%20Clive%20Mitchell.pdf |
| India | 211 620 000 | https://ibm.gov.in/writereaddata/files/01312023164915Graphite_2021.pdf |
| Korea, North* | 2 000 000 |
https://investingnews.com/daily/resource-investing/battery-metals-investing/graphite-investing/top-graphite-producing-countries/ |
| Korea, South* | 1 800 000 |
https://investingnews.com/daily/resource-investing/battery-metals-investing/graphite-investing/top-graphite-producing-countries/ |
| Madagascar | 174 500 000 | https://nora.nerc.ac.uk/id/eprint/538618/1/Graphite%20in%20Africa%20EIG%202022%20Clive%20Mitchell.pdf |
| Malawi | 65 000 000 | https://nora.nerc.ac.uk/id/eprint/538618/1/Graphite%20in%20Africa%20EIG%202022%20Clive%20Mitchell.pdf |
| Mozambique | 1 400 000 000 | https://nora.nerc.ac.uk/id/eprint/538618/1/Graphite%20in%20Africa%20EIG%202022%20Clive%20Mitchell.pdf |
| Namibia | 9 560 000 | https://nora.nerc.ac.uk/id/eprint/538618/1/Graphite%20in%20Africa%20EIG%202022%20Clive%20Mitchell.pdf |
| Norway | 1 840 000 | https://www.arctictoday.com/norge-mining-acquires-skaland-graphite-as-europes-largest-natural-graphite-producer/ |
| Romania | 50 000 000 | https://www.researchgate.net/publication/383238680_The_Graphite_Occurrences_of_Romania_in_the_Context_of_Energy_Transition_and_Raw_Material_Request |
| Russia* | 14 000 000 | https://investingnews.com/daily/resource-investing/battery-metals-investing/graphite-investing/top-graphite-producing-countries/ |
| Sweden | 50 200 000 | https://www.mining-technology.com/projects/vittangi-anode-project-sweden/?cf-view, https://talgagroup.eu-central-1.linodeobjects.com/app/uploads/2023/11/01134529/06.B-Mineral-Resource-Fact-Sheet-Vittangi_FINAL.pdf, https://leadingedgematerials.com/woxna-graphite/ |
| Tanzania | 41 800 000 | https://nora.nerc.ac.uk/id/eprint/538618/1/Graphite%20in%20Africa%20EIG%202022%20Clive%20Mitchell.pdf |
| Turkey |
7 200 000 |
https://eurogeologists.eu/sari-hidden-graphite-resources-in-turkey-a-new-supply-candidate-for-europe/ |
| Uganda | 16 350 000 | https://nora.nerc.ac.uk/id/eprint/538618/1/Graphite%20in%20Africa%20EIG%202022%20Clive%20Mitchell.pdf |
| Ukraine | 230 000 000 | https://geogroup.com.ua/en/blog-en/graphite-deposits-in-ukraine-availability-and-prospects/ |
| United States | 71 200 000 | https://www.mining.com/graphite-one-triples-alaskas-mine-reserves/, https://www.graphiteoneinc.com/graphite-one-announces-updated-graphite-creek-resource-and-reserve-estimates-tripling-proven-and-probable-reserves/ |
| Vietnam | 6 000 000 | https://www.thaiscience.info/journals/Article/APER/10905841.pdf |
Global graphite resources are approximately 3,540 million tons. Table 8 summarizes resource data for 27 countries, with the largest country-specific resources exceeding 300 million tons (Canada, Brazil, Australia), Mozambique as high as 1,400 million tons. China's graphite resources are also significant (264.53 Mt), Ukraine (230.00 Mt) and India have large unexploited potential (211.62 Mt), and equally significant resources in Madagascar (174.5 Mt).
The resource numbers include all reported tons, if available (measured, indicated and inferred tons). The source materials of the table 8 are not equal, there are reliability differences, and in some references, it was not possible to state whether the reporting was in accordance with the JORC code or NI 43-101 guidelines (or not compiled according to these procedures at all). A mineral resource accounts for all mineralization in an area; a mineral reserve only includes the portions of a resource that are economically viable. If the tonnage on the table is presented as a reserve, it is marked by *.
Graphite is most abundant in Africa (46% of total 3,798 Mt), while Asia resources accounting for 13%. Other continents share approximately 10% each of global resources (North America, Europe, South America and Australia). In Europe, the largest natural graphite deposits occur in Ukraine (230.00 Mt), with notable deposits also in Sweden, Romania, Finland and Greenland. The graphite content ranges by deposit from 1.74-40 wt.%, with approximately 70% of the reported grades being 1.74-10 wt.% (more than 20 wt.% are found in amorphous graphite deposits). Country-specific resources are not comparable because reserve data are related to both decades ago and current exploration and inventory activities.
| Country | Classification | Quantity (Mt of ore) | Grade (% Natural Graphite ) | Reporting code | Reporting date | Deposit, Source |
|---|---|---|---|---|---|---|
| Austria | Amorphous | 1.50 | 40.00 | NA | NA | Kaisersberg |
| Finland | Flake | 26.70 | 4.80 | JORC | 28 Aug 2019 | Aitolampi |
| Greenland | Flake | 23.05 | 20.41 | JORC | 31 Jan 2024 |
Amitsoq |
| Norway | Flake | 1.84 | 23.60 | JORC | 4 Apr 2019 | Traelen (Skaland) |
| Sweden | Fine flaked | 36.90 | 23.10 | JORC | 6 Oct 2023 |
Vittangi |
| Sweden | Flake | 13.30 | 7.38 | NI 43-101 | 6 Jun 2021 | Woxna |
In EU graphite production is only in Austria. For this reason, graphite produced in Norway is an important addition to the EU market. In Norway graphite is mined from the underground Skaland mine. Production volume is about 10,000 tons flake graphite per year. In Sweden, the production of flake graphite has been tested in Woxna. The production area includes four deposits under mining leases, fully built processing plant and infrastructure. The company is targeting a vertically integrated mine to anode material production. The graphite in the Vittangi area, Sweden is fine-grained (amorphous). The reserves include Nunasvaara, Jalkunen, Vittangi and Raitajärvi deposits. Production is due to start in the near future, with an annual production of 120 000 tons. Extracted graphite will be concentrated at mining site and processed into anode material at Talga’s refinery in Luleå. The Aitolampi deposit in Finland contains flake graphite [Grafintec, 2025]. Research and the acquisition of the necessary permits for production are ongoing. Kaisersberg’s graphite in Austria is crystalline and processed into powder and flake forms. Products range, from ultra-fine to coarse-milled flakes, with carbon contents from 40% to over 99%.
Table 9 shows the EU's natural graphite resources, which are under production or estimated in accordance with the JORC code or NI 43-101 guidelines, totalling 103 million tons. The battery industry uses anode graphite made from flake graphite, and spherical forms are also possible to process from fine flaked graphite concentrates. The bedrock in the Nordic region is potential for highly crystalline flake type occurrences, also Greenland. Over 60% of the occurrences in Table 9 contain flake size graphite. Fine flaked graphite occurs in areas of greenschist facies metamorphism, while coarse flakes are typical of high metamorphic schist areas (metamorphosis at upper amphibolite facies conditions). Coarse flakes are in very good demand in the production of technical materials.
Deposits of flaked graphite usually contain less than 10 wt.% graphite, exceptionally rich deposits contain more than 20 wt.% graphite. Deposits of amorphous graphite usually have a high carbon content of 20-40 wt.%. The highest concentrations and reserves occur in the black schists of the Vittangi area, while the highest flake graphite concentration at Skaland mine in Norway [Norge Mining, 2024]. The largest flake graphite reserves occur at Woxna. The most important natural graphite deposits in the EU and their associated reserves are listed in Table 10.
| Deposit | Country | Reserves (Mt) | Resources (Mt) | Grade (% Graf) | Graphite (MT) | Company | Source | ||
|---|---|---|---|---|---|---|---|---|---|
| Nunasvaara | Sweden | NA | 2.30 | 24.1 | 554 300 | Talga Group Ltd |
Talga 15 Feb 2024 |
||
| Jalkunen | Sweden | NA | 31.5 | 14.9 | 4 693 500 | Talga Group Ltd |
Talga 15 Feb 2024 |
||
| Vittangi | Sweden | NA | 35.0 | 23.8 | 8 330 000 | Talga Group Ltd |
Talga 15 Feb 2024 |
||
| Raitajärvi | Sweden | NA | 4.30 | 7.1 | 305 300 | Talga Group Ltd |
Talga 15 Feb 2024 |
||
| Woxna | Sweden | NA | 13.3 | 7.83 | 1 039 824 | Leading Edge Materials Corp. |
Leading Edge Materials PR June 6, 2021 |
||
| Aitolampi |
Finland |
NA | 26.7 | 4.8 | 1 281 600 | Graphintec Oy |
Grafintec Oy Oct 30, 2019 |
||
| Skaland | Norway | 1.84 | 1.84 | 23.6 | 434 240 | Norge Mining Ltd |
Norge Mining 16 Dec 2024 |
||
| Kaisersberg | Austria | 0.16 | 1.5 | NA | NA |
Grafitbergbau Kaisersberg GmbH |
Lauri et al. 2018 |
EU’s resources of natural graphite are 116.4 Mt. This corresponds to about 15% of global resources (279 Mt), while reserves are 2.0 Mt (0.7% of global reserves, Table 7, USGS, 2025). However, the EU’s graphite potential is higher than that presented in Table 10. In Romania and Czechoslovakia there are graphite sources in previously mined deposits. New occurrences have been mapped in the Nordic region, including Greenland. Resources are defined to contain all mineralization in the area (measured, indicated and inferred). Of these inferred are estimated with a low level of confidence instead measured and indicated resources have been verified by appropriate sampling. Reserves are those parts of the ore that are recoverable in mining.
Most of the EU’s graphite resources are amorphous or fine flakes type (64.1%), deposits in the Vittangi area in Sweden and Kaisersberg in Austria. Romanian and Czechoslovakian production was also in amorphous graphite (and existing resources). Resources in Finland and Norway, also Woxna in Sweden are flake graphite deposits. Of these, the flake graphite from the Skaland mine is one of the richest deposits in the world, with a graphite content of about 23%. Graphite is typically mined in open pits, while Skaland’s production is in underground mine.
According to WMD statistics [World Mining Data, 2026], production of natural graphite was around 0.6 million tons in the early 2000s (Figure 15). The amount of mining increased strongly by 2007, exceeding 1 million tons. The three largest producers China, India and Brazil rate for over 90% of total production of which China, with its 0.8 million tons of production, accounted for around 70%. In the year 2018, production volumes continued to grow up to 1,500,000 tons and have remained at the same level in the 2020s (1,562,000 tons in 2024). China continues to dominate the mine production, 1,208,000 tons in 2024, share around 80% of global production and slightly that higher 1,280,000 tons in 2025 (market share 82%). Mozambique produced 97,342 tons (6.4%) in 2024, followed by Madagascar with 60,720 tons (4.0%) and Brazil with 56,053 tons (3.7%). A significant share of global production (more than 50%) in the early 1980s came from other countries, 297,321 tons (category Rest of the world in Figure 15), while a decade later in 1994 it was only 133,194 tons. The share of Rest of the world countries has steadily decreased, being only about 14% of all tons mined in 2004 (81,496 tons), and only about 4% in 2024 (57,658 tons). Norway's 10,500 tons of annual mining covers about 18% of Rest of the world production and 0.7% of the global annual availability of natural graphite.
USGS statistics show that global production was over a million tons in 2022, 1,314,950 tons (Figure 16). The largest producer was China with 850,000 tons, followed by Mozambique with 170,000 tons, Madagascar with 110,000 tons and Brazil with 87,000 tons. The four largest producers accounted for 92.6% of global production (1,217,000 tons), with the remaining tons (97,950 tons) came from Canada (1.1%), Russia (1.1%), India (0.6%), Ukraine (0.2%) and Rest of the World (4.3%). According to USGS data, global annual mining was less than 1 million tons before 2003, then 1,160,000 tons until 2013. Production volume declined for a few years, reaching only 815,000 tons in 2016, then rising again to over a million tons, 1.1 million tons in the year 2018. In the period shown in Figure 16 China's production has accounted for over 60% of global production from the early 2000s to the present, peaking at nearly 80% in 2016 (around 67% in 2023 and high share 82% in 2024). India's share of production has declined from just over 10% to one percent over the past decade (peaking at 170,000 tons in 2014, 14.7%). African countries have been important producers of natural graphite since 2018. According to USGS data, Mozambique and Madagascar mining totalled 227,000 tons in 2023 (a share of the global production as high as almost 20%).
Supply of graphite from secondary materials and from production waste does not play significant role compared to the total demand in EU. Graphite can be utilized from secondary material like spent MgO-C refractories and Li-ion batteries. Main waste streams in industrial production are fine fractions after spheroidization of graphite flakes applied in Li-ion batteries and Kish graphite formed in steelmaking processes. Kish graphite occurs mainly in desulfurization slag and blast furnace dust.
| MSA Flow | Value | ||
|---|---|---|---|
No data in Table
Natural graphite is increasingly applied as anode material for lithium-ion batteries (LIBs). Flat flakes are usually mechanically turned into spherical shapes (“spheroidization”). Characteristic of the spheroidization procedure is that the yields are usually around 50-60%, waste consisting fine flakes and undersized graphite spheres. Industrial spheroidization and fractionation processes, uses a rotor impact mill, an air jet sieve, and an air classifier [Rapp et al., 2016]. Graphite fines < 10 µm are commonly discarded or sold at a loss. Graphite powder is utilized in powder metallurgical applications, adding heat resistance, lubrication, and precision in moulding [PMD, 2024]. Graphite powder gives chemical stability and improves the high temperature resistance of rubber products. Graphite additive also reduces wear and tear of rubber products as well in some special industrial fields, it is necessary to make the rubber conduct electricity [Qingdao Furuite Graphite, 2025].
Kish graphite consists of a potential additional secondary natural graphite resource that produced from the steel making process. It is formed on the free surface of molten iron and grows in a foliated dendritic manner. Graphite flakes are formed in varying quantities, sizes and purities in steel plants. Flotation has been tested as effective methodology for the purification of kish graphite. Purification degree over 90% C was observed using single flotation in case of large flake sizes (>500µm), while in case of smaller flake sizes (<500µm), multiple froth floats are required. A technical-economic assessment has been performed for a 10,000 ton per year process plant, indicating that the exploitation of this secondary resource could be economically possible [Frost, 2014].
The natural graphite production process is mechanical in nature, including mining, crushing, grinding, foaming, drying and screening.
Natural graphite ores are mined from either surface or underground mines depending on the proximity of the ore body to the surface. Most flake graphite deposits are exploited using open-pit mining methods, especially when the ore is intensively weathered; however, underground mining methods are employed in few cases of steeply dipping orebodies with high-grade minable lenses (> 15 % C). Open-pit mining involves conventional drilling and blasting methods for hard rocks or standard soft rock mining techniques. Drift mining, hard-rock mining, shaft mining and slope mining are methods used in underground mines [Robinson et al., 2017].
The mineral processing of natural graphite for the production of flake graphite and powder concentrates depends on the rock containing the graphite, the ore type and the grade. It varies from a simple hand sorting and screening of high-grade vein graphite and some high-grade amorphous graphite ores to a complex beneficiation process. The main steps in a standard processing route of flake graphite ore are crushing and grinding, followed by flotation and screening:
Mechanical preparation. It is an essential stage in natural graphite’s mineral processing as size and grade are the two commercially important parameters of natural graphite products. The crushing and grinding steps have to be optimised to minimise size reduction of constituent particles (flakes) but simultaneously maximise the liberation of gangue minerals.
Flotation. Natural graphite is naturally hydrophobic; therefore, it can be upgraded by flotation. A multi-stage flotation process is generally applied. After washing to remove clay materials, the ore is subjected to a first rough flotation followed by secondary grinding and cleaning flotation. The graphitic carbon content of flake graphite concentrates range between 85% and 97%. A highly concentrated grade with few impurities is desirable for further refining as it lowers the purification costs.
Screening. The concentrate is then dried, screened and classified to a variety of products of various sizes. Commercial flake graphite available for end-uses or further processing is available in distinct sizes e.g. jumbo (+50 mesh, i.e. >300 μm), large (-50+80 mesh, i.e. 180-300 μm), medium (-80+100 mesh, i.e. 150-180 μm), fine (-100 mesh, i.e. < 150 μm). Different classifications are possible.
Graphite is mechanically processed by micronizing and spheroidizing to increase the electrical energy density in the anodes. Extremely high carbon contents are required in many industrial application and graphite concentrates are purified by chemical thermal treatment. In fire retardants applied expandable graphite is synthesized by carrying out the oxidation of graphite pieces, submerged in sulphuric acid, reference [Nanografi, 2025A]. Flexible expanded graphite for sealings is made from natural graphite flakes by chemical preparation with acids and oxidizing agents, followed by a violent heat treatment procedure.
The marketed products of natural graphite are classified by purity and particle size in three distinct categories:
Amorphous graphite: It consists of grains with a tiny crystal size (microcrystalline graphite). Amorphous graphite is the most abundant but least pure commercial type of natural graphite. Typical commercial purity varies between 80-85 % graphitic C. Amorphous graphite is the lowest valued quality of natural graphite.
Flake graphite: It is coarse-grained crystalline graphite that consists of platelets of graphite layers (flakes). Flake graphite is of higher quality than amorphous graphite and has the broadest range of end uses. Commercial purity ranges from 85 % up to 97 % graphitic C. Flake graphite is marketed in different sized flakes (small, medium, large, jumbo), ranging between 40 μm and 1 cm in size.
Vein or lump graphite: It occurs in nature at the highest purity, grain size and crystallinity of the natural graphite extracted commercially. Vein graphite is the rarest form and the premier quality of natural graphite. Vein graphite is suitable for many products like flake graphite. It is generally used in advanced, thermal and high-friction applications such as car brakes and clutches. The special feature of the plot graphite is that it can be formed into solid shapes without the aid of a binder addition.
Other considerations
Natural graphite is an inert and non-hazardous toxic material [Leguérinel and Le Gleuher, 2017], it is not subject to restrictions by the EU chemical regulation, REACH [ECHA, 2019]. CAS Number is 7782-42-5 and EC Number: 231-955-3. A chemical safety assessment (CSA) according to REACH is not required. Internationally, graphite is regulated in occupational health legislation with threshold limit values ranging from 0.3 mg/m³ to 15 mg/m³ for dust and aerosols [IFA, 2021]. Graphite is not harmful to the environment; dusting of the fine powder should be taken into account when handling. It is, stable in storage (avoid very high heat and keep away from strong oxidants).
Natural graphite is an inert and non-hazardous material [Leguérinel, M. and Le Gleuher, M.,2017], and as all naturally occurring substance it is not subject to the REACH regulation [ECHA, 2019] but exempted from registration under Annex V and no restrictions for use are in place
A significant portion of the annual demand for graphite will be in the anodes of Li-ion batteries in coming years, approximately 80%. Currently, anodes manufactured in the Far East are mainly made of synthetic graphite. Ten years ago, globally about 60% of battery anodes were made of natural graphite. The strong growth in demand for Li-batteries has mainly increased the production of synthetic graphite. Almost 80% of battery anodes in 2023 were made of synthetic graphite and according to the forecast, up to almost 90% in 2025.
The production of natural graphite into anode graphite includes mining, enrichment, spheroidization, purification, and coating. The global warming potential (GWP) per kilogram of natural graphite is 6.5 kg CO2eq. Two-thirds of the carbon emissions come from the spheroidization process 4.4 kg CO2eq, for which China currently has a monopoly. Spheroidization is the process in which flake graphite particles are mechanically rounded. This leads to the loss of some material but yields improvements in the performance of the anode [Benchmark, 2025A]. The production of synthetic graphite, on the other hand, is very energy intensive, with an average of 14.4 CO2eq for production in China, while in Inner Mongolia 24.6 CO2eq, where electricity is produced with coal. The emissions are equivalent to the emissions of the very energy-intensive aluminium production (manufacturing from bauxite raw material), in China 20 kg CO2eq per 1 kg of aluminium [ALUPRO, 2025]. Considering the EU's lower CO2 emissions, the production of anode graphite (both natural and synthetic graphite) is more environmentally friendly in the EU than in the Far East, where a large part of the electricity is still produced by burning coal.
According to [Engels et al., 2022], natural graphite manufacturing is characterized by energy intense production processes (including extraction and grinding), mainly being operated in China with low energy prices and a relatively high GHG emission intensity of electricity generation. The results of the LCA show that the production of 1000 kg of natural graphite anode material has a global warming potential (GWP) of approximately 9,61 kg CO2eq. This also includes carbon coating, producing 3,95 tons of CO2 emissions per ton of anode-ready graphite
Mining can be seen as having negative impacts on environments, including deforestation, erosion, contamination and alteration of soil profiles, contamination of local streams and wetlands, and an increase in noise level and dust. Graphite enrichment is based on the traditional flotation process. Floated and screened graphite is typically purified for demanding applications using hydrofluoric acid and sodium hydroxide. Graphite refining processes are built on the principle of a closed loop.
Graphite can be separated from used Li-ion batteries for reuse in new Li-ion batteries [Chernyaev et al., 2024]. The challenges is are the so-called black mass and its impurities, which requires chemical leaching and pyrolytic treatment to clean. Recycling of graphite concentrate floated from used refractory MgO-C materials has also been studied [Kangal et al.,2006]. Fire-resistant bricks are the second largest application of natural graphite after battery anodes and available for recycling from side streams of the steel industry. Consumption of MgO-C bricks (magnesia-carbon) per ton of steel generally ranges from 0.5 kg to 3 kg per ton (kg/t) of steel. A typical steel plant can generate more than 5,000 tons of spent refractory per year, in which graphite content is about 12 wt.%.
This substance is not registered under the REACH and no standards could be found in the scientific literature review.
Mining brings local prosperity. Employment in the region increases and the need for services increases. Mines, mineral enrichment and metallurgical further processing have a positive impact on the diversification and development of education in the region. In certain countries, the state and regions can collect mining taxes or similar fees, through which there is also an opportunity to improve the local economy and prosperity.
Among natural graphite producers, the relative economic importance compared to other sources of state revenue was highest in 2023 in Madagascar (1.12%), Mozambique (0.6%), and Tanzania (0.041%), Table 12. The largest export revenues in 2023 were in China ($402M), other natural graphite exporters were Mozambique ($71M), Madagascar ($48.3), Brazil ($23M) and Canada ($13.6M) [OEC, 2025B].
| Country | Export value (USD) | Share in total exports |
|---|---|---|
| China | 402 000 000 | 0.012% |
| Mozambique | 71 000 000 | 0.600 % |
| Madagascar | 48 300 000 | 1.120 % |
| Brazil | 23 000 000 | <0.01% |
| Canada | 13 600 000 | <0.01% |
| Norway | 11 100 000 | <0.01% |
| Sir Lanka | 4 760 000 | 0.035 % |
| Tanzania | 4 610 000 | 0.041 % |
| Ukraine | 933 000 | <0.01% |
| Russia | 325 000 | <0.01% |
| Ethiopia | 322 000 | <0.01% |
It is important for the industry to build the ethical graphite supply chain guided by the principles national regulations and according to the United Nations Sustainable Development Goals. It is equally important to establish strong and positive relationships with our stakeholders, particularly in regional communities.
The industry must take into account the working conditions in the importing country when sourcing raw materials and that these leaders and actors are committed to following the United Nations Guiding Principles on Business and Human Rights, 2011. It is worth paying particular attention to identifying any shortcomings in social and ethical sustainability in importing countries. Many Western countries’ green transition commodities mining operations are located in developing regions where working conditions may not meet international standards. Working conditions can be dangerous and the training and equipment available may not be up to the task. Health care can be inadequate, and workers may not have any insurance, for example in the event of accidents. Environmental pollution caused by mining can have a negative impact on local communities. The methods used to extract minerals can also raise ethical questions about sustainability and social responsibility. While cobalt is a battery mineral that has repeatedly made headlines, large-scale graphite mining has also been the subject of occasional controversy, including concerns over how Graphite mining is allegedly causing serious impacts on communities in Mozambique [Business & Human Rights Resource Centre news, 2023].
China is the leading supplier of natural graphite, both to the EU and globally. The level of governance in China is, on average, low, mainly due to the low score in the governance dimension of “voice and accountability” (World Bank 2018).
Graphene Technologies: In the past few years, different methods of synthesis have been developed starting from graphite in order to produce different types of 2D graphene-like materials as pristine graphene, graphene oxide, or reduced graphene oxide. 2D graphene-like materials were employed in many technologies and green technologies. As example:
Energies generation and storage: Fuel Cells, Hydrogen generation, batteries, supercapacitors, photovoltaic.
Electronics & Photonics: Hybrid systems Silicon-Graphene, where the graphene is added to deliver additional functionalities. Prominent for applications in the flexible technologies. Sensors, flexible and printed electronics, optoelectronic and photonic devices.
Additive to composites and coatings to enhance their mechanical properties for energy saving. Typical host materials are polymers, carbon-reinforced polymers, ceramics, concrete, etc. where the addition of graphene/2D materials shall improve mechanical and functional properties usually addressing a weakness of the host material. Graphene Flagship Technology and Innovation Roadmap [Graphene Flagship, 2025].
Natural graphite is widely used in industrial materials and manufacturing processes. It can be applied as a filler for metals and polymers. Its properties can be tailored chemically and thermally (expanded graphite and surface treatments). There is a growing demand for graphite, among others for electronics and solar panels. Graphite composites are employed in aerospace, healthcare, and automotive industries to produce intricate structures that are lightweight. Emerging technologies are also in printed electronics, including touch screens and sensors. Technologies are developing for exfoliation procedures, new applications of intercalated compounds are entering the market, and GO and rGO graphite and applications are also the subject of active research. An example of new innovations in the applicability of graphite is a new carbide-carbon material (graphite–chromium carbide composite), which developed through the EU-funded I.FAST project, could prove to be a scalable option as a thermal conductor in demanding conditions [CERN, 2024].