Overview
Iron ore is the source of primary iron for the iron and steel industry. It consists mostly of iron oxides, the primary forms of which are magnetite (Fe3O4) and hematite (Fe2O3). Iron (chemical symbol Fe, atomic number 26, transition metal group) is a lustrous silver-grey metal with density of 7.87 g/cm3 and melting point of 1,530°C. Pure iron is rarely used as it is relatively soft (4 in Mohs hardness scale) and oxidises rapidly in air to hydrated iron oxides, commonly known as rust. Iron is commonly used as an alloy with other elements to make thousands of different steel grades and other alloys with a vast range of desirable properties. Iron ore smelting in the presence of a reductant generally yields an alloy of iron and carbon (pig iron) which usually contains 3.5-4.5% carbon along with small amounts of other elements such as silicon, manganese and phosphorus.
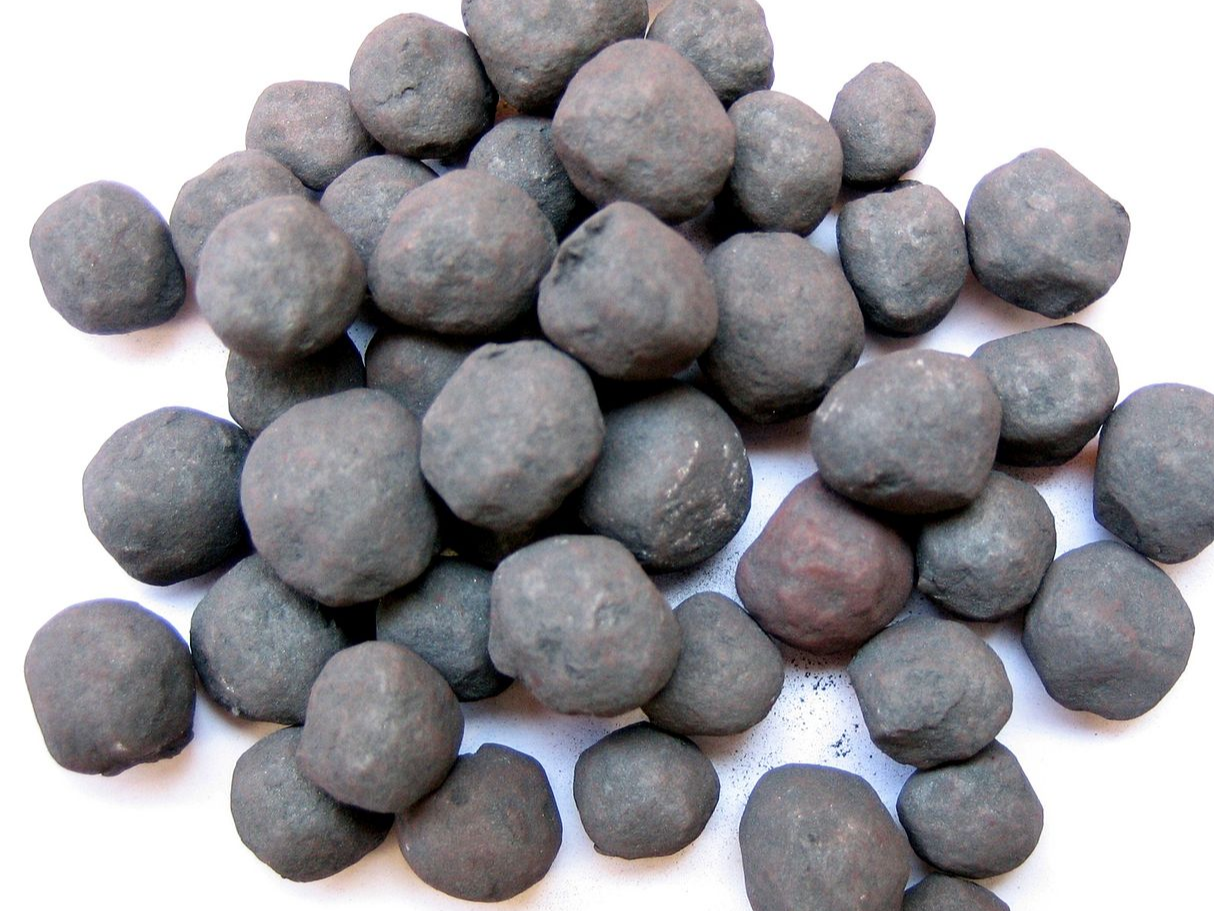
Iron ore pellets figure: By Qwarc at the Lithuanian language Wikipedia, CC BY-SA 3.0, https://commons.wikimedia.org/w/index.php?curid=9875512
| Global production | Global producers | EU consumption | EU share | EU suppliers | Import reliance |
|---|---|---|---|---|---|
| 1,534,153,080t | Australia 38% Brazil 17% China 12% India 10% Russia 4% South Africa 3% Canada 3% Iran 2% Ukraine 2% | 75,631,939t | 5% | Sweden 24% Brazil 22% Canada 17% South Africa 12% Ukraine 11% Liberia 5% Mauritania 3% | 73% |
| Global production | Global producers | EU consumption | EU share | EU suppliers | Import reliance |
|---|---|---|---|---|---|
| 1,773,982,303t | China 55% India 7% Japan 5% United States 4% Russia 4% Korea, South 4% | 132,937,989t | 8% | Germany 26% Italy 15% Spain 8% France 8% Poland 5% Austria 5% Belgium 4% Netherlands 4% Sweden 3% Slovakia 3% | 5% |
Until the early 2000s, the price of iron ore was exclusively fixed by annual over-the-counter (OTC) negotiations between producers and steel producers. The explosion of the Chinese steel demand and the resulting tightening of the iron ore supply disturbed the prevailing pricing system, and the spot market emerged in the early 2000s. Chinese steel producers, in view of the steady growth of steel production in China, faced supply difficulties in the conventional market dominated by non-Chinese companies, and they turned to iron ore from India marking the beginning of a more flexible and transparent parallel spot market. The annual price-fixing system eventually collapsed in 2010, and BHP, Vale and Rio Tinto put in place a system of quarterly price-fixing closer to the prices recorded on spot markets, which were much higher than the annual reference prices fixed in 2008. Iron ore prices have since experienced significant volatility, and most of the iron ore trade continues to use long-term contracts [Le Gleheur,2019].
Iron ore prices rose sharply from 2020 to 2021 because of the economic recovery from COVID-19 pandemic and reached a peak of USD 214/dmtu or EUR 177/dmtu [USGS mineral summaries,2000-2025]. The average price decreased from 2021 to 2022 to the average level of USD 121/dmtu or EUR 114/dmtu in 2022 and stayed flat from 2022 to 2023. From 2023 onwards the global prices of iron ore have decreased due to economic slowdown in many key steel-consuming sectors [USGS mineral summaries,2000-2025].
Iron ore prices are expected to stay at an average USD 100/dmtu level for 2025, because of weak expected demand.
The global production of iron ore in iron content averaged 1,534 Mt between 2020 and 2024 according to World Mining Data (Figure 24). Australia, Brazil, China and India are the most important iron producers. Their average annual production in iron content in the period 2020-2024 was: 581 Mt, 263 Mt, 180 Mt and 155 Mt, respectively. The EU average annual production between 2020 and 2024 was 20.1 Mt in iron content of which Sweden produced 18.9 Mt in iron content. [World Mining Data,since 1984]
The recycling of steel and ferrous alloys has a crucial importance on the environmental protection and the sustainable development of the mining/metallurgical sector. Steel is 100% recyclable and has a potentially infinite life cycle without loss of properties. The World Steel Association reports that in 2021 about 680 million tonnes of ferrous scrap were recycled, making steel the most recycled material in the world by volume [World Steel Association,2025B].
The recycling process of steel is well established globally, and it is an integral part of steel manufacturing. Steel recycling reduces the demand for primary ore, and at the same time offers substantial environmental benefits and savings in raw material inputs. In particular, steel production from scrap requires a lower amount of energy in comparison to production from iron ore decreasing by about half the generation of CO2 emissions. At the same time, every tonne of steel scrap used in steelmaking offsets the consumption of around 1,400 kilogram of iron ore, 740 kilogram of coal and 120 kilogram of limestone required by the integrated steelmaking route [World Steel Association,2025B].
In the EU, ferrous scrap plays a vital role in steel making. Approximately 45% of the crude steel output in 2023 was produced by the EAF route that uses up to 100% ferrous scrap, while globally the share of electric arc furnaces in steel production was about 29% in 2023 [Eurofer,2024], [World Steel Association,2025].
Iron ore is is the main feedstock raw material for primary steel production and for cast iron production. Approximately 98% of the iron ore shipped worldwide is consumed in iron and steel manufacturing (USGS mineral summaries 2000-2025). The remaining 2% of the total iron ore consumption is used in a range of non-steel applications. The steel, iron and other applications are described below.
Iron is the by far mostly used metal in our society. Globally, an average of 219 kg steel was used per person in 2023 (World Steel Association 2024). Steel, which is an alloy of iron, carbon and other elements, is closely linked to many different downstream industrial sectors.
According to World Steel Association, the main global uses of steel are building and infrastructure (52%), Mechanical equipment (16%), Automotive (12%), Metal products (10%), Other transport (5%), Electrical equipment (3%) and Domestic appliances (2%). [World Steel Association,2025]
In 2024, the construction sector, which includes buildings and infrastructure, accounts for about 37% of steel demand in Europe. Other significant steel consuming sectors are automotive (20%) and other transportation (3%), mechanical engineering (12%), metalware (16%), tubes (8%), domestic applicances (3%) and other sectors (2%). For both Europe and the world, the use structure changed only slightly within the past decade. For Europe, the share of automotive has increased 4% units, between 2020 and 2024. [Eurofer,2025A]
| Use | Percentage | Substitute | Sub share | Cost | Performance |
|---|---|---|---|---|---|
| Construction | 38% | no substitute | 53% | No substitute | |
| Construction | 38% | Reinforced concrete | 30% | Similar or lower costs | Similar |
| Construction | 38% | Timber | 7% | Similar or lower costs | Reduced |
| Construction | 38% | Masonry | 6% | Similar or lower costs | Similar |
| Construction | 38% | Others | 4% | Similar or lower costs | Similar |
| Automotive | 16% | no substitute | 75% | No substitute | |
| Automotive | 16% | Aluminium | 13% | Slightly higher costs (up to 2 times) | Similar |
| Automotive | 16% | Magnesium - alloy | 7% | Very high costs (more than 2 times) | Similar |
| Automotive | 16% | Composites/carbon fibre | 5% | Very high costs (more than 2 times) | Similar |
| Mechanical engineer | 15% | no substitute | 50% | No substitute | |
| Mechanical engineer | 15% | Titanium | 13% | Very high costs (more than 2 times) | Similar |
| Mechanical engineer | 15% | Magnesium - alloy | 13% | Very high costs (more than 2 times) | Similar |
| Mechanical engineer | 15% | Aluminium | 13% | Slightly higher costs (up to 2 times) | Similar |
| Mechanical engineer | 15% | Composites | 13% | Very high costs (more than 2 times) | Similar |
| Metalware | 14% | no substitute | 50% | No substitute | |
| Metalware | 14% | Copper | 10% | Very high costs (more than 2 times) | Similar |
| Metalware | 14% | Bronze | 10% | Slightly higher costs (up to 2 times) | Similar |
| Metalware | 14% | Silver | 10% | Very high costs (more than 2 times) | Similar |
| Metalware | 14% | Plastics | 10% | Similar or lower costs | Reduced |
| Metalware | 14% | Aluminium | 10% | Very high costs (more than 2 times) | Similar |
| Tubes | 10% | no substitute | 90% | No substitute | |
| Tubes | 10% | Aluminium | 10% | Slightly higher costs (up to 2 times) | Similar |
| other | 3% | below 10%, not assessed | 100% | No substitute | |
| transport | 2% | below 10%, not assessed | 100% | No substitute | |
| Domestic applliances | 2% | below 10%, not assessed | 100% | No substitute |
Substitutes have been identified for the applications of steel in construction, automotive, mechanical engineering and metalware. There are no substitutes for iron ore itself, but steel and iron scrap can to a certain extend and depending on its quality serve as alternative raw materials for iron- and steelmaking.
Iron is the cheapest and most widely utilized metal. In many applications, iron and steel compete with either cheaper non-metallic materials or more costly materials that offer superior performance [USGS mineral summaries,2000-2025].
Iron and steel production is the largest metals sector in volume as steel is an omnipresent and indispensable material across the economy. With no perfect substitutes currently on the horizon, the underlying demand for steel is expected to remain robust. Demand for steel is expected to continue rising in the future, as demand for goods and services increases with economic and population growth.
Global crude steel production totalled about 1,890 million tonnes and apparent steel use was estimated at about 1,760 million tonnes in 2023 (World Steel Association, 2024). Global steel production is estimated to increase to 2,265 million tonnes by 2050 [OECD,2024]. In the IEA’s Stated Policies Scenario, global end-use demand for steel is expected to reach 2,100 million tonnes by 2050, a nearly 40% increase from end-use demand in 2019 [IEA,2020].
Secondary production is projected to grow faster than production from iron ore. In 2060, the share of world steel production from secondary sources will range between 39% and 43%, whereas in 2017 was 28% [OECD,2019A]. Total scrap availability might total over 1,500 million tonnes in 2050 [SMS Group,2024]. Also, the direct reduced iron (DRI) production is expected to increase from 6% in 2022 to 13% by 2050 [Wood Mackenzie,2023]. Share of electric-arc furnace (EAF) technology in steel production is expected to rise from 28% in 2022 to almost 50% by 2050 (ibid.).
Transition towards greener steel production technologies reduces the demand of primary production from iron ore. However, in shorter term, the iron ore mine production is expected to increase from 2,500 million tonnes (iron content 1,600 million tonnes) in 2024 to about 3,000 million tonnes in 2030 after which the demand is expected to plateau [USGS mineral summaries,2000-2025], [Fitch Solutions,2024].
According to the notifications provided by companies to ECHA in REACH registrations no hazards have been classified for iron ores [ECHA,2022A]. Iron ore extraction can have detrimental impacts on the quality of the air, the water and on the biological species. An in-depth analysis in Liberia showed degraded water quality because of surface runoff and leachate that are frequently generated from large volume overburden and tailings that are produced during iron ore mining and subsequent processing activities. [Geekia, A.,2016].
A life cycle assessment of GHG emissions for iron ore mining and processing in China shows that the mean life-cycle GHG emissions for Chinese iron ore production are 270 kg CO2e/tonne, with a 90 % confidence interval ranging from 210 to 380 kg CO2e/tonne [Gan et al.,2018].
The top three countries with the highest economic share of iron ore exports are Australia (22.8 %), Brazil (9.6 %) and Bahrain (7.5%) in 2023 [OEC,2025A].
Trade restrictions for iron ores and concentrates are in place in India (export tax and qualified exporters list + other export measures) and Saudi Arabia (licencing requirements) in 2022 [OECD,2024A].
Market analysis, trade and prices
| Global production | Global producers | EU consumption | EU share | EU suppliers | Import reliance |
|---|---|---|---|---|---|
| 1,534,153,080t | Australia 38% Brazil 17% China 12% India 10% Russia 4% South Africa 3% Canada 3% Iran 2% Ukraine 2% | 75,631,939t | 5% | Sweden 24% Brazil 22% Canada 17% South Africa 12% Ukraine 11% Liberia 5% Mauritania 3% | 73% |
| Global production | Global producers | EU consumption | EU share | EU suppliers | Import reliance |
|---|---|---|---|---|---|
| 1,773,982,303t | China 55% India 7% Japan 5% United States 4% Russia 4% Korea, South 4% | 132,937,989t | 8% | Germany 26% Italy 15% Spain 8% France 8% Poland 5% Austria 5% Belgium 4% Netherlands 4% Sweden 3% Slovakia 3% | 5% |
The average global production of iron ore was 1,516 million tonnes between 2019 and 2023 in Fe content. During this period the main producers of iron ore include Australia (38%), Brazil (17%), China 12%, India 10%, and Russia 4%. The world’s top exporters of iron ore (2023) were Australia and Brazil with respectively €78.9B and €31.4B ($79.6 billion and $26.5 billion) [OEC,2025A]. For processing stage iron ore (steel, CN 72), top exporters are China €61.2B ($66.2 billion), €61.2B Germany €30.1B ($32.6 billion) and Japan €29.2B ($31.6 billion) in 2023 [OEC,2025B]. China is by far the largest importer of iron ore, 1,180 million metric tons in 2023 (around 710 million tonnes in Fe content). The largest importers of steel are the EU with 39.2 million tonnes and the United States with 26.2 million tonnes. [World Steel Association,2025]
The biggest market players and iron ore producers in 2023 were Vale, Rio Tinto, BHP Group and Fortescue Metals Group, producing 321, 290, 247 and 192 million tonnes and making up 13%, 12%, 10% and 8% of the global production share, respectively [Statista, 2024], [Fortesque,2024], [USGS mineral summaries,2000-2025]. The EU average consumption of iron ore is about 80 million tonnes with an import reliance of 74%. Main EU suppliers are Brazil (24%), Sweden (24%), Canada (15%), Ukraine (12%) and South Africa (11%).
For steel, the average global production is 1,770 million tonnes between 2019-2023. Main steel producer is China with a 55% market share, followed by India (6%), Japan (5%), United States (4%), Russia (4%) and South Korea (4%). EU average consumption of steel is about 138 million tonnes with 5% import reliance. Main EU suppliers of steel are Germany (25%), Italy (15%), France and Spain (both 8%). The biggest steel producing companies in 2023 were China Baowu Group (7%), Arcelor Mittal (4%) and Ansteel Group (3%) [World Steel Association,2025].
International price reporting agencies such as “The Steel Index and Metal Bulletin” compile spot prices from physical iron ore trading, and after applying a variety of methodologies, come up with various volume-weighted average reference prices (indexes) within a specified data collection window (e.g., daily, weekly or monthly). The benchmark prices assessed by agencies are used globally for short-term and spot contracts, as well as a basis for discussing longer-term contractual agreements (in any case less than one year). Iron ore’s derivatives market has also developed, e.g., the Singapore Mercantile Exchange (SMX) was one of the first exchanges to offer futures contract in 2011. Sinter fines and lumps make up the bulk of the seaborne iron ore market and are the products most frequently traded on a spot basis. By contrast, the beneficiated iron ore comprising pellet and concentrate is smaller in terms of both volume and liquidity, and weekly assessed indices are therefore more appropriate. [Fastmarkets,2018B]
Chinese demand is a decisive factor for the global iron ore market [Statista, 2024]. The COVID-19 pandemic had and still has a significant impact on the iron ore market, with a slowing global economy weighing on iron ore demand. COVID outbreaks and a depressed property sector in China have put further pressure on the market. Increased output from Australia and Brazil alleviates some of the negative effects, but the market was still sluggish in 2022. In 2024, the demand for crude steel, and thus iron ore, in the key market of China has declined by 3.6% in comparison to 2023. However, the Chinese iron ore imports remain strong, which signals a build-up of iron ore inventories [Fitch Solutions,2024]. In 2024, the global steel demand is expected to continue a three-year downward trajectory (2022-2024) and drop by 0.9%. However, the demand is expected to bounce back in 2025 and to reach 1,772 million tonnes [World Steel Association,2024].
| Mining | Processing/refining | ||
|---|---|---|---|
| CN Code | Title | CN Code | Title |
| 26011100 | Non-agglomerated iron ores and concentrates (excl. roasted iron pyrites) | 7206 | Iron and non-alloy steel in ingots or other primary forms (excluding iron of heading no. 7203) |
| 26012000 | Roasted iron pyrites | 7207 | Iron or non-alloy steel; semi-finished products thereof |
| 7218 | Stainless steel in ingots or other primary forms; semi-finished products of stainless steel | ||
| 7224 | Alloy steel in ingots or other primary forms, semi-finished products of other alloy steel | ||
The listed CN codes referring to iron ore are: 260111-Iron ores and concentrates (60% iron content), non-agglomerated, 7206- Iron and non-alloy steel in ingots or other primary forms (excl. remelting scrap ingots, products obtained by continuous casting and iron of heading 7203) (100% iron content), 7207- Semi-finished products of iron or non-alloy steel (100% iron content), 7224-Steel, alloy, other than stainless, in ingots or other primary forms, semifinished products of alloy steel other than stainless (excl. waste and scrap in ingot form, and products obtained by continuous casting) (100% iron content) and 7218-Stainless steel in ingots or other primary forms (excl. remelting scrap ingots and products obtained by continuous casting); semi-finished products of stainless steel (100% iron content).
Figure 5 shows EU trade flows of CN 7218 Stainless steel in ingots or other primary forms; semi-finished products of stainless steel from 2000 to 2024. The EU import peaked in 2002 at about 470,000 tonnes and decreased until 2006 where it reached the lowest point at 72,000 tonnes. Since then, the imports have been slightly increasing. The EU import decreased from 365,000 tonnes in 2000 to 334,000 tonnes in 2024. The EU export peaked in 2000 at about 240,000 tonnes. The export decreased from about 240,000 tonnes in 2000 to about 54,000 tonnes in 2024.
Figure 6 illustrates the share of import in EU for stainless steel (CN 7218) from various countries. UK was the main supplier with the share of 86% during all the years (2000-2024). Other import partners were Indonesia (6%), United States and Russia (2%) and the Rest of the World (9%). In 2024, UK was the main supplier (83%), followed by Indonesia (18%) and India (1%). Import from Russia stopped in 2023.
Figure 7 shows the import and export trend of CN 7207 semi-finished products of iron or non-alloy steel during the year 2000-2024. The EU import and export EU in the past two decades (2000-2024) fluctuated rather greatly. Import peaked in 2007 at about 11.0 million tonnes, whereas export peaked in 2002 at about 2.8 million tonnes. The EU import increased from 5.2 million tonnes in 2000 to 6.6 million tonnes in 2024. The export decreased from 2.62 million tonnes in 2000 to 1.17 million tonnes in 2024.
Figure 8 illustrates the share of import in EU for semi-finished products of iron or non-alloy steel from various countries. Russia was the main supplier with the share of 38% during all the years (2000-2024). Other import partners were Ukraine (32%), Brazil (9%) and United Kingdom (7%). In 2023, Russia was the main supplier (44%), followed by Ukraine (15%), China (10%), Brazil (8%) and Vietnam (6%).
Figure 9 shows the import and export trend of CN 7206 Iron and non-alloy steel in ingots or other primary forms (excl. remelting scrap ingots, products obtained by continuous casting and iron of heading 7203) over the period from 2000 to 2023. The EU export and import had a relatively same value between 2000 and 2003. Then the export started to increase from 2004 onwards. The export had some fluctuations with an increasing trend but from 2018 it showed a declining trend and reached about 9,600 tonnes in 2024. The import also had an increasing trend with fluctuations over the years. Furthermore, the import and export of Iron and non-alloy steel in ingots or other primary forms fell during 2019 and 2020 during the COVID-19 pandemic. From 2020 to 2024, the import increased from 15-year low 91,000 tonnes to all-time high 329,000 tonnes.
Figure 10 illustrates the share of Iron and non-alloy steel in ingots or other primary forms from various countries. The main supplier to EU from 2000 to 2023 was Russia (26%), Venezuela (16%), Norway (15%), India (14%), and the Rest of the World (29%). The import from Russia significantly raised since 2006 and Russia was the main supplier of non-alloy steel in ingots or other primary forms in the most years between 2006 and 2021, but was reduced to 0 tonnes by 2023. From 2022 onwards, India has taken over almost the whole import to EU accounting for 97% of imports in 2023.
Figure 11 shows the import and export trend of Iron ores and concentrates, non-agglomerated (excluding roasted iron pyrites). EU is net importer of Iron ores and concentrates. EU import showed a decreasing trend with some fluctuations from about 101 million tonnes in 2000 to 53 million tonnes in 2024. In 2008, the EU import decreased 54% from 101 million tonnes to 55 million tonnes due to the financial crisis and its impact on steel demand. The import also fell during 2019 and 2020 during COVID-19 pandemic. EU’s export of Non-agglomerated iron ores and concentrates increased considerably from 0.2 million tonnes in 2000 to about 1.9 million tonnes in 2024.
Figure 12 illustrates the share of import in EU for Iron ores and concentrates, non-agglomerated from various countries. The main import partners of EU (2000-2024) have been Brazil (48%), Ukraine (12%), Canada (10%), Mauritania (incl. Spanish Sahara from 1977) and South Africa (6%), Norway and Liberia (2%) and Rest of the World (14%). In 2024, the main suppliers are Canada (30%), Brazil (25%), South Africa (16%), Ukraine (14%) and Liberia (5%). Import from Russia ceased in 2023.
Figure 13 presents the import and export trend of CN 7224 Alloy steel in ingots or other primary forms, semi-finished products of other alloy steel. During the years 2000-2024, the EU import and export of CN 7224 showed relatively great fluctuations. The EU import increased from about 205,000 tonnes in 2000 to 350,000 tonnes in 2024. The EU export increased from about 100,000 tonnes in 2000 to 260,000 tonnes in 2024. For the most years, the EU export showed the lower amount, sitting at an average of 192,000 tonnes/year, whereas the EU imports averaged 297,000 tonnes/year from 2000 to 2024.
Figure 14 illustrates the share of CN 7224 Alloy steel in ingots or other primary forms, semi-finished products of other alloy steel from various countries. The EU import to EU in the past over two decades (2000-2024) fluctuated rather greatly. The main supplier to EU between 2000 and 2024 was Russia (38% of share), followed by UK (12%), Ukraine and Turkey (11%), Brazil (10%) and Rest of the World (12%). In 2024, the main EU suppliers were Russia (32%), China (17%), Turkey (13%), Ukraine (11%) and Brazil (11%).
Until 2008, EU imported little quantity of roasted iron pyrites (up to 550,000 tonnes in 2006) but then it drops to less than 500 tonnes since 2018 and to less than 35 tonnes since 2021. Export peaked in 2011 with nearly 400,000 tonnes, but has been 5,000 tonnes or less since 2020. Between 2003 and 2008 the imports were mainly from Ukraine (Figure 7 and Figure 8).
Until the early 2000s, the price of iron ore was exclusively fixed by annual over-the-counter (OTC) negotiations between producers and steel producers. The explosion of the Chinese steel demand and the resulting tightening of the iron ore supply disturbed the prevailing pricing system, and the spot market emerged in the early 2000s. Chinese steel producers, in view of the steady growth of steel production in China, faced supply difficulties in the conventional market dominated by non-Chinese companies, and they turned to iron ore from India marking the beginning of a more flexible and transparent parallel spot market. The annual price-fixing system eventually collapsed in 2010, and BHP, Vale and Rio Tinto put in place a system of quarterly price-fixing closer to the prices recorded on spot markets, which were much higher than the annual reference prices fixed in 2008. Iron ore prices have since experienced significant volatility, and most of the iron ore trade continues to use long-term contracts [Le Gleheur,2019].
Multiple factors are of importance for iron ore prices. Iron ore is a variable commodity having specific physical and metallurgical properties affecting its price (e.g., Fe content, physical form) and premiums and discounts are applied to account for quality differences. For example, higher iron grade achieves a higher price, while lump ores and pellets that can be charged directly into the blast furnace attract a premium in comparison to fines requiring sintering prior to use. The profit margin that steelmakers are achieving drives the relative preference for different ore types, i.e., when profit margins are high, steelmakers prefer to use high-purity ores to maximise their blast furnace yield. It also depends on market availability and circumstances (e.g. ore used in the direct-reduction process to make direct-reduced iron (DRI) needs to be of much higher grade than that fed into a blast furnace), constraints derived from the end-use applications of steel (e.g. higher-grade flat steel products require higher-quality raw material inputs with lower impurities), and environmental considerations (e.g. lower-grade ores with higher fractions of impurities such as silica and alumina require increased consumption of coke, which can raise emissions). [Fastmarkets,2018B]
The massive demand growth driven by the industrialisation of China has had a distinct effect on the iron ore price evolution. The peaks in price evolution are associated with supply deficits incurred in the seaborne market, and the troughs with periods when supply growth eventually exceeded demand growth [Wilson, J.,2015], [S&P Global,2019]. A strong upward trend is observed from 2005 to mid-2008 when prices surged before collapsing rapidly within one year during the global financial crisis [Löf and Ericsson,2016]. Iron ore prices recovered almost to their pre-crisis levels by mid-2011 induced by increased demand from China due to an economic recovery plan to counter the effects of the global financial crisis, mainly based on infrastructure investments, which boosted demand for steel [Le Gleheur,2019]. Since the end of 2013, iron ore prices declined significantly and were below the average price by 2015 due to the fast capacity expansion, particularly from the three largest producers, i.e., Vale, Rio Tinto and BHP Billiton [Löf and Ericsson,2016]. In 2019, the prices rose sharply due to a supply deficit after supply disruptions coupled with strong steel demand in China. For most of June 2020, iron ore prices traded above USD 100 per tonne for the first time since August 2019. This is due to a sharp expansion in steel production in China alongside tightness in supply [S&P Global,2020].
Iron ore prices rose sharply from 2020 to 2021 because of the economic recovery from COVID-19 pandemic and reached a peak of USD 214/dmtu (dry metric tonne unit) or EUR 177/dmtu [USGS mineral summaries,2000-2025]. The average price decreased from 2021 to 2022 to the average level of USD 121/dmtu or EUR 114/dmtu in 2022 and stayed flat from 2022 to 2023. From 2023 onwards the global prices of iron ore have decreased due to economic slowdown in many key steel-consuming sectors [USGS mineral summaries,2000-2025].
Iron ore prices are expected to stay at an average USD 100/dmtu level for 2025, because of weak expected demand. Long-term price forecasts expect lower prices of USD 90/dmtu in 2028. [Fitch Solutions,2024]
Iron and steel production is the largest metals sector in volume as steel is an omnipresent and indispensable material across the economy. With no perfect substitutes currently on the horizon, the underlying demand for steel is expected to remain robust. Demand for steel is expected to continue rising in the future, as demand for goods and services increases with economic and population growth.
Global crude steel production totalled about 1,890 million tonnes and apparent steel use was estimated at about 1,760 million tonnes in 2023 [World Steel Association,2024]. Global steel production is estimated to increase to 2,265 million tonnes by 2050 [OECD,2024]. In the IEA’s Stated Policies Scenario, global end-use demand for steel is expected to reach 2,100 million tonnes by 2050, a nearly 40% increase from end-use demand in 2019 [IEA,2020].
Steel demand growth will be partially decoupled from GDP growth due to a decrease of material intensity in the global economy. In case of improved efficiency of the steel-intensive industrial sectors in China and India, the report projects a 17% overall lower demand for steel in comparison with the baseline scenario, and the majority of the reduction will be met through decreased primary steel production. In general, secondary production is projected to grow faster than production from iron ore. In 2060, the share of world steel production from secondary sources will range between 39% and 43%, whereas in 2017 was 28% [OECD,2019A]. World Steel Association expects that 900 million tonnes end-of-life scrap is available in 2050, in comparison to 390 million tonnes in 2018. In 2020, the ferrous scrap recycling amounted for 720 million tonnes in total. [World Steel Association,2021]. Total scrap availability might total over 1,500 million tonnes in 2050 [SMS Group,2024]. Also, the direct reduced iron (DRI) production is expected to increase from 6% in 2022 to 13% by 2050 [Wood Mackenzie,2023]. Share of electric-arc furnace (EAF) technology in steel production is expected to rise from 28% in 2022 to almost 50% by 2050 (ibid.).
Transition towards greener steel production technologies reduces the demand of primary production from iron ore. However, in shorter term, the iron ore mine production is expected to increase from 2,500 million tonnes (iron content 1,600 million tonnes) in 2024 to about 3,000 million tonnes in 2030 after which the demand is expected to plateau [USGS mineral summaries,2000-2025], [Fitch Solutions,2024].
Demand
Annual average worldwide consumption of iron ore is estimated at 2,385 million tonnes for 2019-2023. The average EU consumption of iron ore is estimated at 102 million tonnes for 2019-2023. [World Steel Association,2025].
Iron ore extraction stage EU consumption is presented by HS codes CN 26011100 - Non-agglomerated iron ores and concentrates (excl. roasted iron pyrites), CN 26011200 - Agglomerated iron ores and concentrates (excl. roasted iron pyrites) and 26012000 - Roasted iron pyrites. Import and export data is extracted from Eurostat. Production data is extracted from WMD [World Mining Data,since 1984].
At extraction stage, the average apparent EU demand of iron ore between 2020 and 2024 is about 76 million tonnes (Figure 18).
For steel (iron ore processing stage), the average global consumption is estimated at about 1,742 million tonnes in 2020-2024. The average EU consumption of steel is estimated at about 137 million tonnes for EU in 2020-2024. [World Steel Association,2025]. According to Eurofer [Eurofer,2025A] the average apparent steel consumption in the EU was 135 million tonnes in 2020-2024, whereas the real consumption was 140 million tonnes in 2020-2024.
Iron ore processing stage (crude steel) EU consumption is presented by HS codes CN 7206 - Iron and non-alloy steel in ingots or other primary forms (excl. remelting scrap ingots, products obtained by continuous casting and iron of heading 7203), CN 7207 - Semi-finished products of iron or non-alloy steel, CN 7218 - Stainless steel in ingots or other primary forms (excl. remelting scrap ingots and products obtained by continuous casting); semi-finished products of stainless steel and CN 7224 - Steel, alloy, other than stainless, in ingots or other primary forms, semi-finished products of alloy steel other than stainless (excl. waste and scrap in ingot form, and products obtained by continuous casting). Import and export data is extracted from Eurostat. Production data is extracted from Eurostat Prodcom.
At processing stage, the average apparent EU demand of iron ore (steel) between 2020 and 2024 is about 133 million tonnes (Figure 19).
Average import reliance of iron ore at extraction stage is 74% and at processing stage 5% for 2019-2023.
Iron ore is the main feedstock raw material for primary steel production and for cast iron production. Approximately 98% of the iron ore shipped worldwide is consumed in iron and steel manufacturing [USGS mineral summaries,2000-2025]. The remaining 2% of the total iron ore consumption is used in a range of non-steel applications. The steel, iron and other applications are described below.
Iron is the by far most used metal in our society. Globally, an average of 219 kg steel was used per person in 2023 [World Steel Association,2024]. Steel, which is an alloy of iron, carbon and other elements, is closely linked to many different downstream industrial sectors.
According to World Steel Association, the main global uses of steel are building and infrastructure (52%), Mechanical equipment (16%), Automotive (12%), Metal products (10%), Other transport (5%), Electrical equipment (3%) and Domestic appliances (2%) in 2024 [World Steel Association,2025].
In 2024, the construction sector, which includes buildings and infrastructure, accounts for about 37% of steel demand in Europe [Eurofer,2025A] (Figure 21). Further significant steel consuming sectors are the automotive (20%) and other transportation (3%), mechanical engineering (12%), Metalware (16%), Tubes (8%), domestic applicances (3%) and other sectors (2%). For both Europe and the world, the use structure changed only slightly within the past decade. For Europe, the share of automotive has increased by 4 percentage points between 2020 and 2024.
The relevant industry sectors and their 2- and 4-digit NACE codes are summarised in Table 7 and visualized in Figure 22.
| Applications | 2-digit NACE sector | Value added of NACE 2 sector | 4-digit CPA |
|---|---|---|---|
| Construction | C25 - Manufacture of fabricated metal products, except machinery and equipment | 216,840M€ | C25 - Manufacture of fabricated metal products, except machinery and equipment |
| Automotive | C29 - Manufacture of motor vehicles, trailers and semi-trailers | 205,000M€ | C29 - Manufacture of motor vehicles, trailers and semi-trailers |
| Mechanical engineer | C28 - Manufacture of machinery and equipment n.e.c. | 262,357M€ | C28 - Manufacture of machinery and equipment n.e.c. |
| Metalware | C25 - Manufacture of fabricated metal products, except machinery and equipment | 216,840M€ | C25 - Manufacture of fabricated metal products, except machinery and equipment |
| Tubes | C24 - Manufacture of basic metals | 90,000M€ | C24 - Manufacture of basic metals |
| other | C32 - Other manufacturing | 68,244M€ | C32 - Other manufacturing |
| Domestic applliances | C28 - Manufacture of machinery and equipment n.e.c. | 262,357M€ | C28 - Manufacture of machinery and equipment n.e.c. |
| transport | C30 - Manufacture of other transport equipment | 73,997M€ | C30 - Manufacture of other transport equipment |
Iron ore is used for steel production, cast iron production and in other forms not directly related to steel and iron. In the following, for each of these categories the specific applications are described.
More than half of the steel produced worldwide goes into steel buildings and infrastructure (52% globally, 37% in the EU [World Steel Association,2025], [Eurofer,2025A]). The possibilities for using steel in buildings are manifold: in reinforcing bars in concrete (44%), in sheet products such as in roofs and claddings for exterior walls (31%) and in structural sections of the building frame (25%) [World Steel Association,2025A]. Likewise, steel is found in many non-structural applications such as heating and cooling equipment and interior ducting. Internal fixtures and fittings such as rails and stairs are also made of steel as well as a variety of other construction materials, such as bolts, nails, and screws. Besides, steel is used widely in the construction of major infrastructures including roads, bridges, tunnels, railways, ports and airports in the form of rebar sections, plates and rail track.
Steel is used in all motor vehicles. In 2023, automotive sector is responsible of 12% of global steel consumption and even more, 20%, in Europe [World Steel Association,2025], [Eurofer,2025A]. It is found in the body structure, panels, doors, engine, gears, wheels, tyres and many more. Advanced high-strength steels are used in all new vehicles, which enables them to be lighter compared to conventional steel. Electrical steel with special magnetic properties is the core material for every electric motor today. It is also essential for the engines of electric or hybrid vehicles.
The use of steel in mechanical and electrical equipment ranges from heavy equipment (cranes, bulldozers, drills and scaffolding used in construction) to tools used by the manufacturing sector, and to small household tools. Mechanical engineering products and equipment consumes 16% of produced steel globally and 12% in Europe in 2023 [World Steel Association,2025], [Eurofer,2025A].
Numerous products of everyday use such as cutlery, cookware, office furniture, radiators, packaging and others are made of steel. In 2024, metalware consumed 10% of steel production globally and 16% in Europe [World Steel Association,2025], [Eurofer,2025A].
Pipes and tubes made of steel are used in the energy sector for the transport of oil and natural gas, some of them made of special high-purity grades that withstand corrosion. Ships carrying liquefied natural gas cooled to below -160° C use low-temperature special steels, designed to withstand extreme cold without getting brittle or fragile. In the utilities sector (fuel, water and power), over 50% of the steel used is in underground pipelines to distribute water to and from housing, and to distribute gas. In 2024, tubes consumed 8% of steel production in Europe [Eurofer,2025A].
Beside steel- and ironmaking, iron ore has a variety of minor applications such as ballast, cement clinker production, coal washing, crushed road base material, fertilizer, dense media separation, iron oxide pigments, ferrite magnets, oil and gas well drilling, radiation shielding, water treatment, and other specialty applications [USGS mineral yearbooks,2000-2024].
A variety of applications ranging from fridges to washing machines and other smaller equipment belong to the domestic appliances. In 2024, domestic appliances consumed 2% of produced steel globally and 3% in Europe [World Steel Association,2025], [Eurofer,2025A].
Other typical applications for steel in the transport sector include ships and shipping containers, trains and rail cars as well as aircraft. Globally, 5% of steel is consumed in other transport and 2% in Europe [World Steel Association,2025], [Eurofer,2025A].
| Use | Percentage | Substitute | Sub share | Cost | Performance |
|---|---|---|---|---|---|
| Construction | 38% | no substitute | 53% | No substitute | |
| Construction | 38% | Reinforced concrete | 30% | Similar or lower costs | Similar |
| Construction | 38% | Timber | 7% | Similar or lower costs | Reduced |
| Construction | 38% | Masonry | 6% | Similar or lower costs | Similar |
| Construction | 38% | Others | 4% | Similar or lower costs | Similar |
| Automotive | 16% | no substitute | 75% | No substitute | |
| Automotive | 16% | Aluminium | 13% | Slightly higher costs (up to 2 times) | Similar |
| Automotive | 16% | Magnesium - alloy | 7% | Very high costs (more than 2 times) | Similar |
| Automotive | 16% | Composites/carbon fibre | 5% | Very high costs (more than 2 times) | Similar |
| Mechanical engineer | 15% | no substitute | 50% | No substitute | |
| Mechanical engineer | 15% | Titanium | 13% | Very high costs (more than 2 times) | Similar |
| Mechanical engineer | 15% | Magnesium - alloy | 13% | Very high costs (more than 2 times) | Similar |
| Mechanical engineer | 15% | Aluminium | 13% | Slightly higher costs (up to 2 times) | Similar |
| Mechanical engineer | 15% | Composites | 13% | Very high costs (more than 2 times) | Similar |
| Metalware | 14% | no substitute | 50% | No substitute | |
| Metalware | 14% | Copper | 10% | Very high costs (more than 2 times) | Similar |
| Metalware | 14% | Bronze | 10% | Slightly higher costs (up to 2 times) | Similar |
| Metalware | 14% | Silver | 10% | Very high costs (more than 2 times) | Similar |
| Metalware | 14% | Plastics | 10% | Similar or lower costs | Reduced |
| Metalware | 14% | Aluminium | 10% | Very high costs (more than 2 times) | Similar |
| Tubes | 10% | no substitute | 90% | No substitute | |
| Tubes | 10% | Aluminium | 10% | Slightly higher costs (up to 2 times) | Similar |
| other | 3% | below 10%, not assessed | 100% | No substitute | |
| transport | 2% | below 10%, not assessed | 100% | No substitute | |
| Domestic applliances | 2% | below 10%, not assessed | 100% | No substitute |
Substitutes have been identified for the applications of steel in construction, automotive, mechanical engineering, metal products and tubes. These are described within this chapter and summed up in Table 8. There are no substitutes for iron ore itself, but steel and iron scrap can to a certain extend and depending on its quality serve as alternative raw materials for iron- and steelmaking.
Substitutes for steel used in construction sector include reinforced concrete, timber, masonry and other construction products that are often used for construction purposes. These alternative materials have in some applications similar performance to steel or used for the same purposes [AISC,2018], [The Construction Index,2012], except for wood for which the substitution performance is assessed in literature from reduced to adequate [Graedel et al.,2015]. Cost is considered equal or in some cases lower for all alternative materials.
Due to its affordability, high performance, good machinability, and recyclability, steel continues to be an essential material in the automotive industry, even for the most up to date vehicles [Zhang and Xu,2022]. High-Strength Steels (HSS) and Advanced High Strength Steels (AHSS) that provide weight reduction and superior performance can replace conventional engineering materials such as cast iron and steel. Potential substitutes for the use of steel in automotive include light alloys such as aluminium, magnesium and titanium alloys and carbon fibre composites. Aluminium is considered the principal substitute and its content in vehicles is expected to rise in the future [Graedel et al.,2015], [Zhang and Xu,2022]. All of the identified alternatives have comparable performance as steel, but the cost is higher, especially for magnesium, titanium and composites [McKinsey,2014], [Zhang and Xu,2022].
Substitutes for steel used in mechanical engineering include composites, aluminium, magnesium and titanium. The performance is assessed as similar, but the cost of the potential substitutes is higher, especially for titanium, carbon fibre composites and magnesium [Rao et al.,2018], [Mouritz A.P.,2012]. Titanium could be an effective substitute for stainless steel in products such as medical devices, in marine applications and aircraft applications (see Titanium factsheet). Fibre-reinforced polymers are considered the primary substitutes in machinery [Graedel et al.,2015].
Steel in appliances and metal goods could be substituted by a variety of materials including plastics, silver, bronze, copper and aluminium. The different substitutes have different characteristics and performance to steel. Aluminium is again considered as the main substitute in metal goods [Graedel et al.,2015].
Reinforced Thermoplastic Pipes (RTP) or Thermoplastic Composite Pipes (TCP) could be substitutes for steel pipes in oil and gas industry. Thermoplastic pipes do not corrode and could be a lighter and cheaper option compared with steel pipes. [NS Energy,2021], [Osborne, J.,2013].
Below 10%, not assessed for substitution.
Below 10%, not assessed for substitution.
Below 10%, not assessed for substitution.
Supply
The average annual amount of extracted and processed iron oxides in EU during the period 2020-2024 was about 20.1 million tonnes in terms of Fe content. In 2019-2023, Sweden is the major iron ore producer in EU (on average 18.9 million tonnes in Fe content), while minor production is taking place also in Austria (on average 1 million tonnes in Fe content), Spain and Germany. [World Mining Data,since 1984].
The average annual imported ores and concentrates and roasted iron pyrites (CN 26011100 + CN 26012000) amount in EU in 2019-2023 was 62.1 million tonnes (Fe content) mainly imported from Brazil, Canada, South Africa and Ukraine. During the same period, around 2.9 million tonnes (Fe content) were exported. According to Eurofer data, about the 56% of EU steel was made from scrap in 2020 (Eurofer, 2020). Average EU scrap consumption was 80.3 million tonnes in 2019-2023, whereas the average net export of scrap was 13.4 million tonnes in 2019-2023. The recycling rate is even higher in EU in case of specific iron products such as: (a) packaging steel (recycling rate exceeded 84% in 2019) (APEAL, 2021), (b) stainless steel (recycling rate exceeds 90% according to 2015 data) (circulareconomy.europa.eu, 2020).
Average crude steel production in the EU was 139.6 million tonnes in 2019-2023. The biggest steel producers in the EU in 2023 were Germany (28%), Italy (17%), Spain (9%) and France (8%). The EU imported 26.6 million tonnes of finished steel products in 2023, and the main import countries were South Korea, India, Taiwan, Turkey, China and Vietnam. The EU exported 16.3 million tonnes of finished steel products in 2023, and the main export countries were Turkey, United States, Switzerland and Mexico. [Eurofer,2024]
EU SOURCING OF IRON ORE
In Sweden, which is by far the leading EU iron ore producer, the iron mine activities are taking place in the Kiruna district of northern Sweden. Underground iron ore mines are operated by Luossavaara-Kiirunavaara AB (LKAB) at Kiruna (magnetite) and Malmberget (magnetite and hematite), operating at a depth of more than 1 km [LKAB,2025]. According to WMD around 16.7 million tonnes of iron ores with Fe content were extracted in Sweden in 2024 [World Mining Data,since 1984]. In 2015, the Kiruna Mine was the largest underground iron ore mine in the world in terms of the value of production [USGS mineral summaries,2000-2025]. The ore is extracted using the sub-level caving technique which, after drilling and blasting, utilises gravity to get the ore to fall into underlying production tunnels. Apart from underground mines, iron ore is also extracted in the open-cast mines at Leveäniemi and Gruvberget in the same district [LKAB,2025].
In Austria, iron ore is mined from the Erzberg open-pit mine operated by VA Erzberg GmbH and located in Eisenerz (Styria), which contains the largest siderite deposit in the world. According to WMD [World Mining Data,since 1984]. iron ores with Fe content around 1,046 ktonnes were extracted in Austria in 2024. The output of the Erzberg mine supplies Voestalpine Stahl GmbH’s steel plants in Donawitz and Linz [USGS mineral summaries,2000-2025], [VA Erzberg,2025].
In Spain, Minas de Alquife is an open-pit iron ore mine and was reopened in 2020 [Minas de Alquife ,2025]. According to WMD around 95 ktonnes of iron ores with Fe content were extracted in Spain in 2024 [World Mining Data,since 1984].
According to WMD iron ores with Fe content around 80 ktonnes were extracted in Germany in 2024 [World Mining Data,since 1984]. Barbara Erzbergbau GmbH mines iron ore at the Wohlverwahrt-Nammen mine in Porta Westfalica, North Rhine-Westphalia, where only low-grade iron ore is produced (around 15% Fe content) which finds use as construction additive [USGS mineral summaries,2000-2025], [Barbara Erzbergbau,2019].
EU SOURCING OF CRUDE STEEL
The steel industry is an essential contributor to the EU economy. It directly employed 303,000 people and supported 2.6 million indirect jobs in the associated value chains in 2023. In 2023, the EU industry generated around EUR 152,000 million of Gross Value Added. In the EU, steel is produced in about 500 sites including primary steelmaking in Blast Furnace/Basic Oxygen Furnace (BOF) integrated steelmaking, secondary steelmaking in Electric Arc Furnaces (EAF), and fabrication of steel mill products. [Eurofer,2024]
According to the latest available data of the Eurofer, in 2024 the EU produced 130 million tonnes of crude steel across 22 Member States, accounting for 7% of the worldwide production, down from 160 million tonnes and 9% in 2018. The share of the BF/BOF route stood at 55% of the total crude steel output in 2023, and the remainder (45%) was produced through the EAF route. In 2024, carbon steel accounted for 77% of the total EU crude steel production, alloy steel for 18%, and stainless steel for 5%. [Eurofer,2025A]. The net import reliance for crude steel is 8% as a percentage of apparent consumption in 2018-2022.
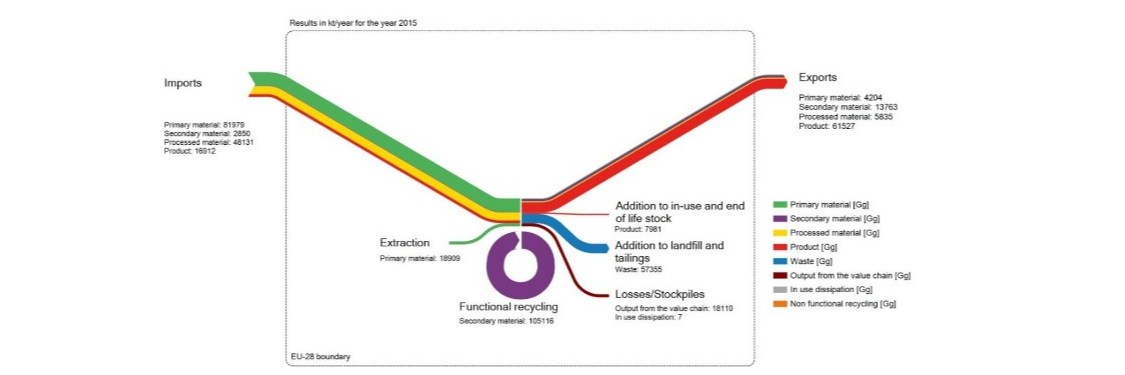
The iron ore material system analysis (MSA) in the year 2015 is shown above.
In 2015, iron ore extraction (mainly from Sweden) amounted to 18.9 million tonnes in iron content. About 12.6 million tonnes in iron content of this was sent to domestic iron making. Four million tonnes of Fe was exported from the EU (note: EU28). Primary ore imports were 76.4 million tonnes in iron content. The greatest part of the resulting Fe input to processing (88.4 million tonnes in iron content) entered the blast furnace to produce pig iron, while the remaining amount (0.6 million tonnes in iron content) was processed through direct reduction. Iron scrap was used in electric arc furnaces (64.4 million tonnes), in basic oxygen furnaces (21.9 million tonnes) and iron casting (3.5 million tonnes). [Passarini et al.,2018]
In 2015, cast steel production in the EU amounted to 166.1 million tonnes in iron content, of which 5.6 million tonnes were exported while 160.5 million tonnes were sent to manufacturing in the EU. Cast iron produced in the EU resulted in 5,4 million tonnes, of which 5.2 million tonnes were sent manufacturing in the EU. Cast steel and cast iron imports amounted 21.8 million tonnes. Total iron input to EU manufacturing was 187.6 million tonnes in iron content of semi-finished products. [Passarini et al.,2018]
Extraction of iron ore is undertaken mostly through surface mining as many deposits are situated near the surface. The extracted iron ore is hauled to the beneficiation plant, where the direct-shipping ores, i.e. those with sufficiently high Fe content (at least 55-58% Fe) undergoes only crushing and screening to produce iron ore lump and sinter feed fines. For lower-grade ores, additional beneficiation is required to remove impurities and achieve sufficient iron content before use in ironmaking. Iron oxide minerals are separated from the gangue through grinding and gravity separation, magnetic separation (for magnetite) or flotation. According to background data by S&P Global [S&P Global,2019A], it is estimated in 2017 the iron ore production consisted of 55% fines, 25% concentrates, and 21% lump ore.
Following separation, agglomeration is required for fine and very fine iron ore concentrates into pellets capable of being transported over long distances and fed directly into the blast furnace. Alternatively, the fine iron ore concentrates can be mixed with residues and additives to produce iron-rich sinters (i.e. semi-fused and solidified lumps of iron oxide) prior to being charged to the blast furnace; the sintering plant is often located adjacent to the blast furnace.
Iron is the second most abundant metal in the Earth’s crust (after aluminium). The average concentration in the continental crust is 6.71% FeOT91, and in the upper crust is 5.04% FeOT [Rudnick & Gao,2014]. Iron forms several common minerals including hematite (Fe2O3), magnetite (Fe3O4), goethite (FeO(OH)nH2O), limonite (2Fe2O3.3H2O), siderite (FeCO3) and pyrite (FeS2). It is also present in many rock-forming minerals, including mica, garnet, amphibole, pyroxene and olivine [Foregs,2006]. The principal iron ores for iron making are hematite (70% Fe content) and magnetite (72% Fe content).
Despite its abundance in the Earth’s crust, only a small part of iron is concentrated in rich deposits. The grade of iron ore deposits varies from 20% to 30% for poorer sources to as much as 60% to 70% for the higher-grade deposits [Comtois and Slack,2016].
Iron ore deposits occur mainly in iron-rich sedimentary rocks known as banded iron formations (BIF). The BIF-hosted iron ore deposits represent the most extensive iron ore resources worldwide and most of the high-grade concentrations of iron ore currently mined. Major BIF-hosted deposits with average ore grade above 60% iron occur in Australia (Hamersley province), Brazil (Quadrilatero Ferrifero and Carajas deposits) and India (Noamundi deposit). Iron ore deposit types also include the volcanic-associated massive sulphide deposits which predominantly consist of iron sulphide in the form of pyrite. With increasing magnetite content, these ores become massive oxide ores of magnetite and/or hematite. Typical examples of such deposits include the Savage River in Tasmania, Fosladen in Norway and Kiruna in Sweden.
Iron ores vary considerably in iron content. On average the iron content of Chinese iron ores is 30-40%, whereas the Fe content of iron ores originating from Australia and Brazilia is above 60%. The iron content of iron ores extracted in Sweden ranges from 45% to 53%.
Concerning iron ore deposits in the EU, the apatite-iron oxide Kiruna-type deposit at the Kiruna district in northern Sweden is mainly composed of apatite-bearing magnetite and accounts for about 80% of EU iron ore production [LKAB,2025]. According to data published by the Fennoscandian Mineral Deposits database [FODD,2017], at the end of the year 2017, the iron ore resources and reserves (including active and closed mines, as well as not exploited deposits and all reporting codes of mineral resources and reserves) of the Kiruna-type deposit amounted to 3,100 million tonnes of ore, of which the iron ore reserves are 1,200 million tonnes of ore.
| Country | Resources (million tonnes in iron content) |
|---|---|
| Australia | 42,775 |
| United States | 27,000 |
Global iron ore resources are estimated to be greater than 230,000 million tonnes in iron content [USGS mineral summaries,2000-2025].The breakdown of resources per countries is given in the Table 7.
Australia's iron ore resources amount for 42,775 million tonnes in iron content [Australian Government,2025].
United States estimated iron ore resources are 27,000 tonnes in iron content USGS mineral summaries,2000-2025].
| Country | Reserves (million tonnes in iron content) |
|---|---|
| Australia | 27,000 |
| Brazil | 15,000 |
| Russia | 14,000 |
| China | 6,900 |
| India | 3,400 |
| Ukraine | 2,300 |
| Canada | 2,300 |
| United States | 2,300 |
| Iran | 1,500 |
| Peru | 1,500 |
| Kazakhstan | 900 |
| Sweden | 600 |
| South Africa | 590 |
| Turkey | 99 |
| Other countries | 8,500 |
The world iron ore reserves are estimated at about 200,000 million tonnes, containing 88,000 million tonnes of iron [USGS mineral summaries,2000-2025]. The world’s largest iron reserves are located in Australia (31%), Brazil (17%) and Russia (16%). The breakdown of reserves per countries is given in the Table 8.
| Country | Classification | Quantity (Mt of ore) | Grade (% Iron ore ) | Reporting code | Reporting date | Deposit, Source | ||
|---|---|---|---|---|---|---|---|---|
| Finland | Historic estimate | 327.7 | 27.85 | None | 12/2017 | [FODD,2017] | ||
| Measured | 190 | 30 | NI 43-101 | [FODD,2017] , [Minerals4EU,2019A] | ||||
| Indicated | 12 | 26 | ||||||
| Inferred | 62 | 32 | ||||||
| Greece | Measured | 7 | 45 (Fe2O3) | USGS | 11/2014 | [Minerals4EU,2019A] | ||
| Inferred | 5 | NA | USGS | |||||
| Historic estimate | 10 | 40-45 (Fe2O3) | None | |||||
| Hungary | A | 0 | NA | Russian classification | 11/2014 | [Minerals4EU,2019A] | ||
| B | 1.75 | 24.4 | ||||||
| C1 | 23.84 | 24.4 | ||||||
| C2 | 11.92 | 24.1 | ||||||
| Lithuania | Indicated (preliminary explored) | 61.69 (million m3) | NA | State reporting code | 1/2015 | [Minerals4EU,2019A] | ||
| Inferred (prognostic) | 58.73 | |||||||
| Portugal | Historic estimates | 790.65 | 38.25 | None | 11/2014 | [Minerals4EU,2019A] | ||
| Slovakia | Verified (Z1) | 4.02 | 33.81 | None | 11/2014 | [Minerals4EU,2019A] | ||
| Probably (Z2) | 12.9 | 33.94 | ||||||
| Anticipated (Z3) | 3.62 | 34.97 | ||||||
| Sub-economic | 51.75 | 30.19 | ||||||
| Spain | Identified | 282 | NA | None | 12/2014 | [Minerals4EU,2019A] | ||
| Indicated | 155.4 | NA | ||||||
| Inferred | 480 | NA | ||||||
| Sweden | Measured | 181 | 42.1 | FRB | 12/2018 | [LKAB,2019] | ||
| Total Resources | 5,622 | 51.7 | PERC | 12/2023 | [LKAB,2024] | |||
| Historic Estimate | 795.16 | 34.89 | None | 12/2018 | [LKAB,2019] |
The most abundant iron ore resources and reserves in the EU are located in Sweden. At the end of 2018, the mineral resources of the operating mines of LKAB are reported in accordance to the FRB standard to 1,440 million tonnes at an average iron grade of 41.8%, whereas the mineral reserves (not included in resources) to 1,151 million tonnes at an average iron grade of 43.7% [LKAB,2019]. Minerals4EU compiled resources data for other countries in Europe (see Table 9)[Minerals4EU,2019A]. Collected data they cannot be summed as they are partial and they do not use the same reporting code.
| Country | Classification | Quantity (Mt of ore) | Grade (% Iron ore ) | Reporting code | Reporting date | Source | ||
|---|---|---|---|---|---|---|---|---|
| Italy | Estimated | 3.5 | NA | None | 03/2015 | [Minerals4EU,2019A] | ||
| Romania | Probable (121) | 57 | NA | UNFC | 11/2014 | [Minerals4EU,2019A] | ||
| Slovakia | Verified | 4.02 | 34 | None | 11/2014 | [Minerals4EU,2019A] | ||
| Probable | 12.9 | 34 | ||||||
| Sweden | Total Reserves | 29.1 | 34.46 | JORC | 12/2017 | [FODD,2017] | ||
| Total Reserves | 70.4 | 42.33 | NI 43-101 | |||||
| Total Reserves | 94.5 | 25.72 | ||||||
| Proven | 1.057 | 43.94 | FRB | 12/2018 | [LKAB,2019] | |||
| Probable | 94 | 40.53 |
USGS estimated the reserves in Sweden at 1,300 million tonnes with iron content of 600 million tonnes [USGS mineral summaries,2000-2025]. Reserve data for Italy, Romania, Slovakia and Sweden is presented in Table 10. Collected data they cannot be summed as they are partial and they do not use the same reporting code.
EXPLORATION AND NEW MINE DEVELOPMENT PROJECTS IN THE EU
Exploration and new mine development projects having iron ore as the main commodity are located in Sweden, Finland and Spain with varying degrees of development and undertaken studies [S&P Global,2019A]. The more advanced ones are the Kallak project in Sweden with total resources estimated at 152,000 ktonnes (27.2% Fe) [Beowuld Mining plc,2021], and the Hannukainen iron-(copper-gold) project in Finland with 221,000 ktonnes of total resources at 32.2% Fe [GTK,2019A], [Hannukainen Mining,2025].
GLOBAL AND EU MINE PRODUCTION
The global production of iron ore in iron content averaged 1,534 Mt between 2020 and 2024 according to World Mining Data (Figure 24). Australia, Brazil, China and India are the most important iron producers. Their average annual production in iron content in the period 2020-2024 was: 581 Mt, 263 Mt, 180 Mt and 155 Mt, respectively. The EU average annual production between 2020 and 2024 was 20.1 Mt in iron content of which Sweden produced 18.9 Mt in iron content. [World Mining Data,since 1984]
The recycling of steel and ferrous alloys has a crucial importance on the environmental protection and the sustainable development of the mining/metallurgical sector. It has been estimated that using steel scrap in the production process [Circulareconomy.europa.eu,2020]:
- Reduces CO2 emissions by 58%
- Saves 72% of the energy needed for primary production (i.e., 4,697 kWh per tonne)
- Saves 1.4 tonnes of iron ore, 0.8 tonnes of coal, 0.3 tonnes of limestone and additives, and 1.67 tonnes of CO2
Steel is 100% recyclable and has a potentially infinite life cycle without loss of properties. The World Steel Association reports that in 2021 about 680 million tonnes of ferrous scrap were recycled, making steel the most recycled material in the world by volume [World Steel Association,2025B].
The recycling process of steel is well established globally, and it is an integral part of steel manufacturing. Steel recycling reduces the demand for primary ore, and at the same time offers substantial environmental benefits and savings in raw material inputs. In particular, steel production from scrap requires a lower amount of energy in comparison to production from iron ore decreasing by about half the generation of CO2 emissions. At the same time, every tonne of steel scrap used in steelmaking offsets the consumption of around 1,400 kilogram of iron ore, 740 kilogram of coal and 120 kilogram of limestone required by the integrated steelmaking route [World Steel Association,2025B].
The average lifetime of steel in different applications and products is another factor to be taken into consideration when examining secondary supply sources. The average life expectancy of steel goods ranges from 35 to 40 years. In construction, the largest consumer of steel, steel will not be available for recovery for several decades, as the average lifetime of steel is above 60 years [Allwood J.M.,2016]. Most steel products remain in use for decades before they can be reused, remanufactured or recycled. Even though all the ferrous scrap would be recycled, there would not be enough to meet the levels of demand for steel products by using the EAF steelmaking route only. The projections of increasing demand imply that primary steel production will continue to play an essential role in the future and, therefore, demand will be met through a complementary and interdependent use of the BF/BOF and EAF production routes [World Steel Association,2025B].
In the EU, ferrous scrap plays a vital role in steel making. Approximately 45% of the crude steel output in 2023 was produced by the EAF route that uses up to 100% ferrous scrap, while globally the share of electric arc furnaces in steel production was about 29% in 2023 [Eurofer,2024], [World Steel Association,2025].
| MSA Flow | Value (ktonnes) | ||
|---|---|---|---|
| B1.1 Production of primary material as the main product in EU sent to processing in EU | 12,625 | ||
| B.1.2 Production of primary material as a by-product in EU sent to processing in EU | 0 | ||
| C.1.3 Imports to the EU of primary material | 81,979 | ||
| C.1.4 Imports to the EU of secondary material | 2,850 | ||
| D.1.3 Imports to the EU of processed material | 48,131 | ||
| G.1.1 Production of secondary material from post-consumer functional recycling in the EU sent to processing in the EU | 66,894 | ||
| G.1.2 Production of secondary material from post-consumer functional recycling in the EU sent for manufacturing in the EU | 0 |
Steel is a very good material for circular economy as it is durable, recyclable and enables a wide variety of life extension strategies for goods and machinery such as reusing, repairing or remanufacturing [World Steel Association,2025B]. In the EU, the availability of old scrap is increasing and expected to reach 122 million tonnes by 2030 [ADEME,2023] which is quite close to the EU production of crude steel, 126 million tonnes in 2023 [Eurofer,2024].
Recycling of post-consumer products is enhanced as steel is used in large amounts in easily recoverable applications (e.g. vehicles and machinery). Also, due to its magnetic properties (except some stainless steel types), it is easy to separate and recover steel from waste streams. According to UNEP, the end-of-life functional recycling rate (EOL-RR) for iron and steel is high, estimated to range from 70% to 90% [UNEP,2011].
Recycling rates from simple products, such as packaging, construction and vehicles is high (80-90%) but for more complex products (for instance electronics) is lower at around 50% [World Steel Association,2025A]. Ferrous scrap originates from different alloys, which changed their composition and increased in number over time to accommodate the latest requirements from technology innovation. This, in turn, influences the recycling process, especially from complex products such as electronics which currently include over 50 different elements in their composition. Apart from the complex product composition, inefficient collection rates are also responsible for the lower recycling rate of electronic EOL products. Moreover, the recovery of steel and other metals from waste electrical and electronic equipment often poses significant challenges to metallurgy if the products are not designed for recyclability and disassembling. In case steel is recycled together with other metals, it is substantially downgraded and in some cases might not be functionally recycled at all [UNEP,2011]. By sector, global steel recovery rates are estimated at 85% for construction, 90% for automotive, 90% for machinery, and 50% for electrical and domestic appliances [Allwood J.M.,2016].
A notable end-of-life recycling performance for iron and steel is shown for the EU. According to the datasets developed by the MSA study of iron (Table 13), of the total amount of old scrap generated at end-of-life in the EU in 2015 (108,000 kt), about 81,000 ktonnes were collected for recycling, resulting in EOL-RR (i.e. the fraction that is recycled at the end of the material’s life cycle) of 75%. If exports are accounted for (EU is a net-exporter of ferrous scrap and waste), the EOL-RR95 decreases to 62%. As regards the end-of-life recycling input rate (EOL-RIR), which measures the quantity of end-of-life scrap (i.e. ‘old scrap’) contained within the total amount of metal available to manufacturers (which would also include primary metal and ‘new scrap’), the input from secondary materials accounted for 31% of the EU metal supply in 2015. [Passarini et al.,2018]. More rencently, EoL-RIR for EU is estimated at 46.48% [Watari et al.,2025].
A quarter of the finished steel made each year (including half of all sheet steel) is never fabricated into a product but is cut off in manufacturing. This represents a significant amount of new scrap available for recycling. In 2008, more than half of the ferrous scrap recycled came from the manufacturing process rather than end-of-life products [European Commission,2018]. However, in comparison with the new scrap, the share of end-of-life scrap availability is rising more rapidly and, globally, is expected to rise from 390 million tonnes in 2018 to 900 million tonnes in 2050 [World Steel Association,2021].
STEELMAKING
Steel is produced via two routes:
- The integrated steelmaking process (BF/BOF), in which iron ores are first converted to iron metal utilising the blast furnace (BF) and then iron is converted to steel in the basic oxygen furnace (BOF);
- The electric arc furnace (EAF) process.
The key difference is the type of raw materials they consume. The BF/BOF route uses as raw materials iron ore, coal (mainly in the form of metallurgical coke), limestone and iron and steel scrap while the EAF route uses mainly iron and steel scrap and electric power to melt the scrap. Electric arc furnaces can be charged by up to 100% ferrous scrap feedstock. The BF/BOF route is the most utilised steelmaking technology worldwide. According to data published by the World Steel Association, in 2023, 71.1% of global crude steel output was produced in oxygen-blown converters which transform pig iron into steel, and 28.6% in electric arc furnaces. In the EU, the share of the EAF production is higher [World Steel Association,2025]. In 2023, 45% of steel output came from electric arc furnaces and 55% from the BF/BOF route [Eurofer,2024]. Another steelmaking technology, the open-hearth furnace (OHF), contributes to less than 1% of global steel output and is no longer utilised in Europe. The OHF process is very energy-intensive and is in decline, on account of its environmental and economic disadvantages.
BLAST FURNACE-BASIC OXYGEN FURNACE INTEGRATED STEELMAKING (BF/BOF)
The blast furnace is the central operational unit in ironmaking in which iron-bearing oxide ores are reduced to elemental iron, also called ‘hot metal’ or ‘pig iron’. The main reducing agent in a blast furnace is coal in the form of metallurgical coke; coke also partly acts as an energy carrier for sustaining the processes within the metallurgical reactor. The blast furnace is a counter-current gas/solids reactor in which the descending column of feed materials (coke, iron ore and fluxes/additives) reacts with the ascending hot gases [IIMA,2025].
Modern high-performance blast furnaces require physical and metallurgical preparation of the charge. Pelletizing and sintering are the two types of iron ore preparation generally applied. The load of the blast furnace is charged from the top consisting of alternate layers of coke and a mixture of sinter and/or pellets, lump ore and fluxes such as limestone to collect impurities. Air which is heated to about 1200°C, is blown into the furnace through nozzles in the lower section [FutureCoal,2025]. The hot blast provides the necessary oxygen to burn the coke and form carbon monoxide, which is the basic reductant for the iron oxides, as well as generates heat to melt the iron. In the furnace, the iron ore is progressively reduced, and molten iron is collected at the bottom of the furnace. The majority of impurities present in the ore and fuel are removed from the melt as a separate liquid by-product called slag, also collected at the bottom of the furnace, floating on top of the molten iron. The process is continuous with raw materials being regularly charged to the top of the furnace and molten iron and slag being tapped from the bottom of the furnace at regular intervals [IIMA,2025].
Part of pig iron can be cast into ingots or rapidly solidify to form granules (granulated pig iron). However, the vast majority of pig iron produced from the blast furnace is consumed within integrated steelmaking complexes where molten iron (hot metal) from the blast furnace is transferred directly to the basic oxygen furnace.
The process converts iron into steel using pure oxygen to oxidise carbon and the unwanted impurities in molten iron. Typically, the carbon content is lowered from around 4% to less than 1%. The necessary energy is obtained from the exothermal oxidation reactions; ferrous scrap is added to the converter in order to cool the process, which typically contains 15-25% (up to 30%) of the furnace charge [World Steel Association,2021]. Upstream ladle desulphurisation of the hot metal and downstream ladle metallurgy of the molten steel are applied in order to refine molten steel and achieve the required quality; in particular, the former is applied when needed (depending on the ore grade) and the latter is a necessary step for targeting the desired steel composition. Ferrous slag is also generated from the added fluxes and the energy of the process, at an average rate of 400 kg per tonne of crude steel [World Steel Association,2025A]. Molten steel is then cast either into ingots or by means of continuous casting into billets, blooms and slabs (semi-finished products). Nowadays, ingots are not common anymore and are used only for some specific/niche applications. In 2017, continuously cast semis (billets, blooms, and slabs) accounted for 96.3% of the world steel output, ingots for 3.5%, whereas the remainder (0.2%) was delivered in liquid form for castings [World Steel Association,2025A].
On average, the integrated steelmaking route uses 1,370 kilogram of iron ore, 780 kilogram of coal, 270 kilogram of limestone, and 125 kilogram of ferrous scrap to produce 1,000 kilogram of crude steel [World Steel Association,2025A].
ELECTRIC ARC FURNACE (EAF) STEELMAKING
The principal material input for the EAF is iron and steel scrap, which may be comprised of scrap from inside the steelworks, cut-offs from iron and steel product manufacturers and post-consumer scrap. The electric arc furnace can be charged with 100% steel scrap. Depending on the plant configuration and on the availability and quality of ferrous scrap, other sources of metallic iron such as direct reduced iron (DRI), pig iron or hot metal can be used in the EAF route too. As in the BF/BOF, a slag is formed by the addition of fluxing agents (limestone and/or dolomite) to refine and condition the steel composition and also to form a protective layer separating the liquid steel from the external atmosphere. In the EAF, around 170 kilogram of slag is produced per tonne of crude steel [World Steel Association,2025A]. The downstream casting process is the same for all the steel production routes.
On average, the EAF route uses approximately 710 kilogram of ferrous scrap, varying amounts of iron sources (i.e. metallics, DRI, hot metal, and granulated iron) corresponding to 586 kilogram of iron ore, 150 kilogram of coal, 88 kilogram of limestone and 2.3 gigajoule of electricity to produce 1,000 kilogram of crude steel [World Steel Association,2025A].
DIRECT REDUCED IRON AND OTHER IRONMAKING PROCESSES
An alternative process of ironmaking is the direct reduction of iron ore oxides in solid-state, i.e. without melting as in blast furnace, with natural gas, hydrogen or coal as reducing agents. Direct reduced iron (DRI), also called sponge iron, is mainly used as feedstock in electric arc furnaces. Hot Briquetted Iron (HBI) is a form of DRI which is briquetted at elevated temperature to form dense briquettes which can be transported and handled efficiently and safely. Because there is no separation of iron from gangue in the reduction facility, high-grade ores must be used (>67% iron and a low gangue content; commonly DRI-pellets grades are commercialised, but the supply is limited). In 2012-2016 (average), global DRI output accounts for about 0.7% of total iron production. DRI's share of ironmaking is rising as, in 2023, DRI production totals 136.5 million tonnes (9.5% of total iron production) [World Steel Association,2025]. However, 72.4% of DRI gas-based, 24.4% coal-based and the rest other reduction types [Zare Ghadi et al.,2023].
Global steel industry accounts for 7% of global energy consumption and 7-9% global greenhouse gas emissions (GHG) [IEA,2020]. DRI has a potential to reduce GHG emissions by 38-97% compared with BF/BOF, lower reduction potential from coal-based DRI and higher from hydrogen and methane based DRI [Ling et al.,2024].
Another process is the production of nodular pig iron which contains much less manganese, sulphur and phosphorus content and is almost exclusively used in foundries and castings.
WORLD AND EU PRODUCTION OF STEEL AND PIG IRON
The average annual global production of pig iron during the period 2019-2023 was about 1313 million tonnes [World Steel Association,2025]. China is by far the larger pig iron producer with about 871 million tonnes in 2023. In 2023, India and Japan are following with 86 and 63 million tonnes, respectively. In EU, Germany is the larger producer with an annual amount of 23.6 million tonnes in 2023.
According to the latest available data of the European Steel Association, in 2023 the EU produced 126 million tonnes of crude steel across 22 Member States, accounting for 6.8% of the worldwide production, down from 160 million tonnes and 9% in 2018 [Eurofer,2024].
EU was the second largest producer of crude steel after China (1,019 million tonnes), with an annual average production of about 139.6 million tonnes during 2019-2023. However, India has caught EU up with 140.8 million tonnes produced in 2023. Germany, Italy, Spain, France and Austria were the major producers of crude steel in EU in 2023 with produced amounts of: 35.4 Mt, 21.1 Mt, 11.4 Mt, 10 Mt and 7.1 Mt, respectively [Eurofer,2024], [World Steel Association,2025].
Other considerations
According to the notifications provided by companies to ECHA in REACH registrations no hazards have been classified for iron ores [ECHA,2022A].
According to IFA, the limit value of iron ore is reported only for Latvia and is estimated 4 mg/m3 for 8 hours of exposure [IFA,2022A]. According to OSHA, the exposure limit for iron is 10mg/m3 [OSHA,2022].
Different lung diseases including lung cancer are the major occupational diseases among mining workers exposed to iron ore dust. However, health hazards that arise due to exposures to the ore dust vary due to the ores’ variable compositions in different mines. Iron ore dust-exposed workers need to be examined periodically to determine early symptoms. Routine environmental monitoring and chemical composition evaluation of iron-ore dust are also recommended. [Banerjee et al.,2006]
It was found that in Western Australia, where iron ore operations involve an integrated system of seven mines, that high levels of dust were compromising the health and the lifestyle of the mine workers [Mining.com,2021].
Iron ore extraction can have detrimental impacts on the quality of the air, the water and on the biological species. An in-depth analysis in Liberia showed degraded water quality because of surface runoff and leachate that are frequently generated from large volume overburden and tailings that are produced during iron ore mining and subsequent processing activities. As most of the mines in the country use overburden as backfilling material for mined out areas, ground water contamination may also result from leaching activities. Iron ore tailings may contain large amount of SiO2, Si, Fe2O3, Fe3O4, Fe (OH), and traces of Hg, Se, Cu, Pb, Zn, As, Mn etc. that are harmful to humans, even at low levels. The investigation of water quality from China Union Iron Ore Mine of Liberia revealed a potential of surface and ground water pollution by iron ore mining. [Geekia, A.,2016].
A life cycle assessment of GHG emissions for iron ore mining and processing in China shows that the mean life-cycle GHG emissions for Chinese iron ore production are 270 kg CO2e/tonne, with a 90 % confidence interval ranging from 210 to 380 kg CO2e/tonne. The two largest contributors to overall GHG emissions are agglomeration (60 %) and ore processing (23 %). Iron content (ore grade) varies from 15 % to 60 % and is the largest contributor (40 %) to the uncertainty of the results. The depletion of rich ore deposits will result in increased exploitation of lower grade ores with the concomitant increase in energy consumption and GHG emissions. [Gan et al.,2018]
The Initiative for Responsible Mining and Sourcing (IRMA) issued a set of Standard for responsible mining processing, intended to apply to a range of minerals – including iron ore. The IRMA Standard is intended to be applicable to sites where smelting, refining or other forms of mineral processing and extractive metallurgy are carried out. [IRMA,2021]
Trade restrictions for iron ores and concentrates are in place in India (export tax and qualified exporters list + other export measures) and Saudi Arabia (licencing requirements) in 2022 [OECD,2024A].
Table 14 lists the countries for which the economic value of exports of iron ore represents more than 0.1 % in the total value of their exports [OEC,2025A].
| Country | Export value (MUSD) | Share in total exports (%) |
|---|---|---|
|
Australia |
85,372 |
22.8 |
| Brazil | 33,963 | 9.6 |
| Bahrain | 1,501 | 7.5 |
| Chile | 1,740 | 1.8 |
| Canada | 7,231 | 1.3 |
| India | 3,871 | 0.9 |
| Cuba | 8 | 0.8 |
| Burma | 93 | 0.4 |
| Fiji | 4 | 0.4 |
| Bolivia | 17 | 0.2 |
| Cambodia | 55 | 0.2 |
| Honduras | 7 | 0.1 |
While the iron mining and processing industry creates jobs and incomes, in countries such as Brazil, for those communities living along a mining railway, adverse impacts normally outweigh any benefit [News Mongabay,2022]. The Carajás Railroad runs 892 kilometres, from the world’s largest open-pit iron ore mine to the port of Ponta da Madeira on Brazil’s Atlantic coast, contributing to record 24 billion USD profit in 2021. However, “many people have died on this railroad, killed by the trains,” as reported by a resident of the community of Auzilândia in Brazil’s Maranhão state. In addition to this, other residents reported of strong and permanent headaches due to the rail noises or suffered structural damages to their houses for the construction of the railway [News Mongabay,2022].
A similar study on the livelihood impacts of iron ore mining-induced land change in Sierra Leone demonstrated that the establishment of industrial iron ore mines in 2011 resulted in gradual urban land expansion (average of 7.5 %) and exponential population growth (600 %) in search of employment through 2018. Notwithstanding, the negative livelihood impacts of iron ore mining on agricultural productivity and forest products was far higher than the positive impacts. [Wilson et al.,2022]
Researchers explore approaches and potential decarbonization paths of the global iron and steel industry: fuel switching to low-C hydrogen, solid biomass, zero-carbon electricity substitution, and retrofit with carbon capture and storage (CCUS) [Kim et al.,2022A], [World Steel Association,2024A].
- Developing methods for using green hydrogen as a reducing agent in place of coal to produce iron (Hydrogen-based Direct Reduced Iron (H-DRI)).
- Technologies to capture CO2 from blast furnace-basic oxygen furnace (BF-BOF) routes (CCUS).
- Molten oxide electrolysis (direct electrolysis of iron ore) to produce iron and oxygen, eliminating direct carbon emissions (Electrolysis-based ironmaking).
- Utilizing bioenergy and waste materials as alternative reducing agents and fuels to replace fossil fuels in ironmaking.
Circular economy
Improving technologies for electric arc furnace (EAF) steelmaking to handle lower-grade scrap and increase the recycled content in steel to reduce reliance on virgin materials [Gurgel et al.,2025].
Developing techniques for the recycling and reuse of slag and other solid residues from steelmaking. [Alex et al.,2025], [Gurgel et al.,2025]
Research on the recycling of steel flows on a global and regional scale revealed that there is considerable variation (10…90%) in the EoL-RIR between steel producing countries with an average EoL-RIR of around 30%. If global steel stock continues to grow, improvements to local circularity may not necessarily lead to global circularity progress. [Watari et al.,2025]
Advances in steel products
Advances in steel products include, for instance, developing products for harsh environments, developing high-performance steels and corrosion resistance and developing steel powders. An Overview and synergies between many European projects on steel are presented in summary of the findings of the Steel Research Technical Groups [European Commission,2025H]. Examples include:
- Developing lightweight, high-performance steels for the automotive sector to improve fuel efficiency without sacrificing safety (Advanced High-Strength Steel (AHSS)).
- Enhancing corrosion resistance and high-temperature properties for demanding applications (Stainless and Alloyed Steels).