Warning: EU consumption in this factsheet corresponds to a calculation of Apparent consumption based on selected trade codes. Therefore, it must be taken with caution. It cannot represent an exhaustive view of consumption of materials embedded in other types of imports (semi products, finished products, etc.).
Overview
Chromium (Cr, atomic number 24) is a lustrous, silvery-white, corrosion-resistant, hard metal. Chromium is obtained by mining chromite, a mineral of chromium and iron and from tailings of PGM operations. The main product of chromite ore refining is ferrochrome, which is an essential component in the manufacturing of stainless steel, a key material in a variety of industries and end-uses. Chromium provides the corrosive resistance properties to stainless steel. In general, chromium presence as an alloying element to steels and non-ferrous metals enhances strength, and resistance to corrosion, temperature and wear. Other important properties are the high melting point, low coefficient of expansion and very high thermal conductivity which allows the use of chromite in foundry sands and refractory materials. Also, the wear resistance, hardness, low coefficient of friction and brightness of chromium are employed to the electrodeposition of chromium plating.
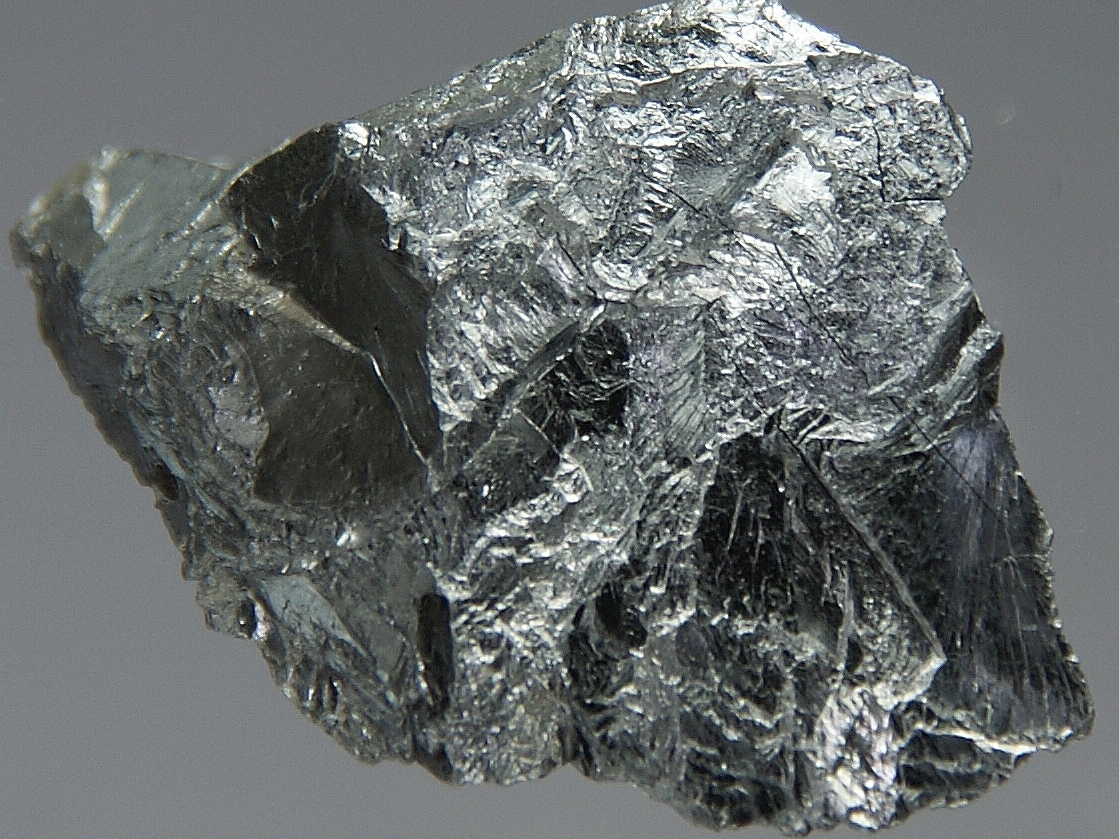
Attribution of the figure: This file is available from Chemical Elements - A Virtual Museum (Jumk.de Webprojects). (images-of-elements.com). Materials from this website available via Creative Commons Attribution 3.0 Unported License.
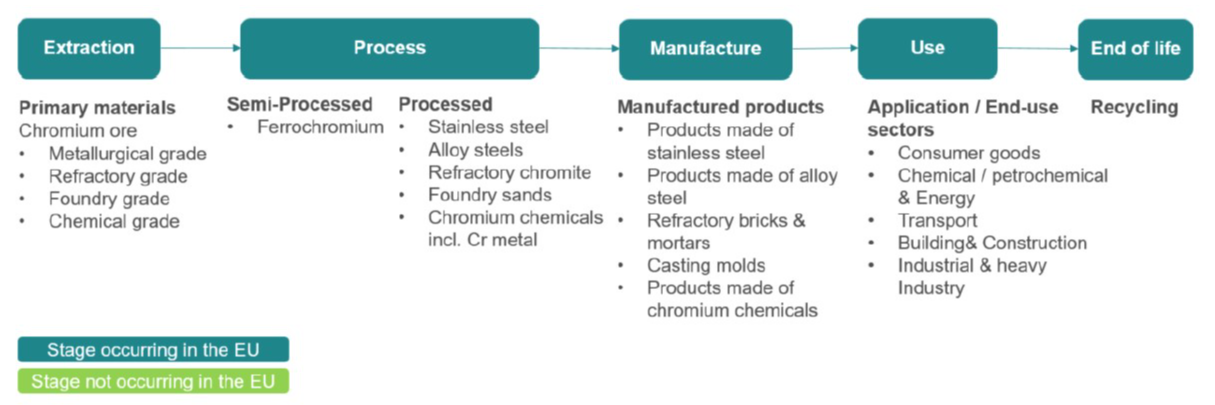
Simplified value chain for Chromium in the EU
Chromium supply and demand (extraction) in metric tonnes, 2020-2024 average
| Global production | Global producers | EU consumption | EU share | EU suppliers | Import reliance |
|---|---|---|---|---|---|
| 9,964,129t | South Africa 52% Kazakhstan 13% India 11% Turkey 8% Zimbabwe 5% Finland 3% Albania 2% | 334,948t | 3% | Finland 81% South Africa 13% Turkey 4% | 16% |
Chromium supply and demand (processing) in metric tonnes, 2020-2024 average
| Global production | Global producers | EU consumption | EU share | EU suppliers | Import reliance |
|---|---|---|---|---|---|
| 10,054,749t | China 53% South Africa 20% Kazakhstan 10% India 6% Finland 2% | 534,663t | 5% | Finland 38% South Africa 21% Sweden 10% Russia 6% Kazakhstan 4% Turkey 3% Zimbabwe 3% India 3% Albania 2% | 39% |
Prices
Chromium is primarily traded and consumed in the form of ferrochromium (FeCr high or low carbon content) to produce stainless steel, with over 80% of the world's ferrochromium used for this purpose. Chromium is traded in the form of chromium ores and concentrates, ferrochrome, chromium metal and chromium chemicals [Roskill,2014]. Chromium ores and concentrates are priced in terms of gross weight and the price depends on specifications, i.e. metal content, impurities and ore type (e.g. lumpy, friable, concentrates). Trends in chromium ores and concentrates prices follow those of ferrochrome, which accounts for 96% of chromite consumption.
In 2020, the chromium metal prices averaged at lowest level since 2007, at about EUR 5,920/t. Since then the price of chromium metal rose to the peak average price of EUR 14,888/t in 2022 but dropped to average of EUR 11,411/t in 2024. [USGS mineral summaries,2000-2025]
Annual average price of Chromium between 2004 and 2024, in USD/t and EUR/t.
Primary supply
Chromium ore is generally mined as a primary product, except for South Africa, where increasing volumes of chromite concentrates are recovered from tailings from PGM operations [Roskill,2014]. The world mine production of chromium reached 14,058 kt (in Cr2O3 content) as an average over 2016-2020, which is equivalent to 9,610 kt in Cr content [USGS mineral summaries,2000-2025], [World Mining Data,since 1984]. South Africa is the world’s largest chromium ore producer, contributing about 45% of the total world supply.
The EU mine production of chromium is concentrated in Finland, as the small production in Greece terminated in 2020, and is averaged at about 280 kt in in chromium content per year over 2020-2024 which is about 3% of global production. Ferrochrome is produced in Finland, Germany and Sweden (306 kt average between 2020-2024 in chromium content. Based on ICDA data, about 135 kt of chromium concentrates and 486 kt ferrochromium in chromium content were imported to EU on average between 2020-2024 [SCRREEN expert network,2026].
EU sourcing of Chromium and global mine production (average 2020-2024)
Secondary supply
There is no specific recycling scheme for pure chromium metal, as the vast majority of chromium is used in the form of alloys. However, stainless steel which accounts for approximatively 70% of chromium’s consumption in the EU [BRGM,2017] is very well recycled. The post-consumer functional recycling of stainless steel reaches rates between 70% and 95%, depending on the product [UNEP,2011], [European Commission,2024]. In general, the scrap content in the production of stainless steel is estimated at 60%, of which 25% consists of old scrap and 35% of new scrap [BRGM,2017]. Stainless steel is commonly recycled in separated flows as its properties will be lost if mixed with common steel scrap.
On the other hand, the detection and sorting of alloy steel products is more complicated, and thus the majority of these products ends up in carbon steel (non-functional recycling) [Deloitte,2015]. Superalloys (non-ferrous alloys containing chromium) are also recyclable in the same application if the scrap is properly sorted for the production of the same alloy. According to data provided by the MSA study of chromium, in 2020 the collection rate at end-of-life was 83%, the overall functional recycling rate (EOL-RR) was 68% and the end-of-life recycling input rate (EOL-RIR) in the EU was 30% [European Commission,2024].
EU uses of Chromium
Uses
Chromium is mainly used in products made of stainless steel (75%). It is also used alloy steel products (20%). A small proportion is used in casting molds, refractories and chemicals.
Uses and possible subsitutes
| Use | Percentage | Substitute | Sub share | Cost | Performance |
|---|---|---|---|---|---|
| Electrical equipment components and products made in stainless steel | 28% | No substitute | 92% | No Substitute | No substitute |
| Electrical equipment components and products made in stainless steel | 28% | Fiber Reinforced Polymers/Carbon Fiber Reinforced Polymers | 5% | Very high costs (more than 2 times) | Similar |
| Electrical equipment components and products made in stainless steel | 28% | Engineering plastics | 2% | Very high costs (more than 2 times) | Similar |
| Electrical equipment components and products made in stainless steel | 28% | Carbon-based Steel | 1% | Similar or lower costs | Reduced |
| Machinery equipment components made in stainless steel | 27% | No substitute | 89% | No Substitute | No substitute |
| Machinery equipment components made in stainless steel | 27% | Fiber Reinforced Polymers/Carbon Fiber Reinforced Polymers | 6% | Very high costs (more than 2 times) | Similar |
| Machinery equipment components made in stainless steel | 27% | Titanium | 5% | Very high costs (more than 2 times) | Similar |
Substitution
There are no substitutes for chromium for its main end uses even if a few percents could be subitutes at higher cost or reduced performance [USGS mineral summaries,2000-2025], [SCRREEN expert network,2026].
Outlook for supply and demand
The global chromium market is anticipated to expand at a compound annual growth rate (CAGR) of 5.5% from 2023 to 2030 (Grand View Research, 2024). The consumption of chromium closely follows the trends in demand for steel, and stainless steel in particular [USGS mineral yearbooks,2000-2024]. Global stainless steel consumption CAGR is expected to be 3-4 % from 2023 to 2025, however, the EU/Africa stainless steel consumption CAGR is estimated at much lower level, -19% in 2023, -5% in 2024 and 2% in 2025 [World stainless steel,2024]. The growth in the supply of chromium ore over the last two decades has strongly followed developments in China, where the country has been increasing ferrochrome capacity (requiring imported feed} to service its stainless steel industry [Backeberg,2020]. Chinese ferrochromium and stainless steel production is affected by oversupply and decreased prices over decreased demand and trade tensions [USGS mineral summaries,2000-2025].
Similar supply forecasts were not identified, but based on USGS ([USGS mineral summaries,2000-2025]) data, global chromium production CAGR for 2019-2024 has been around 1%. The global chromite mine production increased 4% from 2023 to 2024, led by 7% increase in the largest producer country, South Africa. The challenges of South African chromium mining, such as electricity pricing & supply, labour costs, issues with rail and deep-level mining, still exist and could affect the future supply outlook. [USGS mineral summaries,2000-2025]
In the EU, the exposure to chrome ore (extraction) supply risk is driven by the high concentration of global production, the fact that a substantial share of chrome ore is consumed domestically in producing countries and therefore does not enter international trade, the structural concentration of export flows towards Asian markets, which have the capacity to absorb the major share of chrome ore, and policy uncertainty in key producing regions. Any recovery in ferrochrome smelting activity in major producing countries or further beneficiation measures would increase domestic consumption and reduce the volume of chrome ore entering international trade, constraining availability for importing regions, including the EU. Within the EU, no new chrome ore mining projects are currently planned, other than the continued development of the Kemi mine in Finland, the EU’s only active source of primary chrome ore. The EU’s exposure to ferrochrome (processing) supply risk is driven by a combination of high global production and export concentration, limited domestic production capacity, and structural shifts in key supplying regions. [SCRREEN expert network,2026]
Other issues
Chromium may be found in different oxidation states, with CrII, CrIII and CrVI as most common compounds. While the first two compounds may be considered relatively harmless, in its sixth oxidation state, chromium becomes a hazardous compound. Exposure to CrVI through ingestion or inhalation may indeed result in various types of physiological damages: ulcerations (cuts and abrasions of skin, ulcerations of the nasal septum), dermatitis (skin irritation and sensitization), acute respiratory effects (irritation of mucous membranes), carcinogenic effects (e.g. lung cancer), and effects in other organs (e.g. necrosis of kidneys).
In a life cycle perspective, the environmental impacts of chromium production on a per kilogram basis range among the lowest of the metals sector (out of 63 metals) considering the global warming potential, cumulative energy demand, terrestrial acidification and freshwater eutrophication impact categories. However, when considering the global annual chromium production volume (which is relatively significant compared to other metals), the impacts in terms of global warming potential appear among the highest of the metals sector (11th out of 63) [Nuss and Eckelman,2014]. The maximum discharge limit to the aquatic environment in the EU are 1 and 5 mg/l for CrVI and Cr(total), respectively. [Vaiopolou et al.,2020]. Climate impacts of European production of HC and LC FeCr are considered lower than the global averages presented by ICDA, Outokumpu reported 3.34 CO2eq/t for HC FeCr in 2023 [Outokumpu,2025A].
For normative requirements, Zimbabwe has imposed export ban on chromium ores since 2021. South Africa, China and India have licencing requirements for chromium in place. [OECD,2024A]
EU restricts Cr(VI) substances under REACH to protect human health and the environment. In the ECHA restriction proposal, CR(VI) is proposed to be banned in the European Economic Area unless in specific listed industrial use categories. [European Commission,2025A]
Market analysis, trade and prices
Chromium supply and demand (extraction) in metric tonnes, 2020-2024 average
| Global production | Global producers | EU consumption | EU share | EU suppliers | Import reliance |
|---|---|---|---|---|---|
| 9,964,129t | South Africa 52% Kazakhstan 13% India 11% Turkey 8% Zimbabwe 5% Finland 3% Albania 2% | 334,948t | 3% | Finland 81% South Africa 13% Turkey 4% | 16% |
Chromium supply and demand (processing) in metric tonnes, 2020-2024 average
| Global production | Global producers | EU consumption | EU share | EU suppliers | Import reliance |
|---|---|---|---|---|---|
| 10,054,749t | China 53% South Africa 20% Kazakhstan 10% India 6% Finland 2% | 534,663t | 5% | Finland 38% South Africa 21% Sweden 10% Russia 6% Kazakhstan 4% Turkey 3% Zimbabwe 3% India 3% Albania 2% | 39% |
COVID-19 had a significant impact on chromium ore supply and demand due to increased market volatility and reduced demand and pressure on supply chains. Based on WMD, Prodcom and Eurostat data, the average EU consumption of chromium ore (extraction stage) was 360kt and 549 ktonnes in processing stage in chromium content between 2020-2024. According to USGS data [USGS mineral yearbooks,2000-2024] the EU consumption was 927 kt in 2022 in chromium content, which is a modest increase from 886 kt in 2020.
Based on WMD, Prodcom and Eurostat data, the average global production of chromium ore was 9,831 kt in chromium content between 2019-2023. According to ICDA, mining stage (chrome ore) global production is estimated as 36,070 kt, which equals about 11,040 ktonnes in Cr content [ICDA,2025A]. In 2024, EU production was estimated at 494 ktonnes in Cr2O3 (336 ktonnes in chromium content) [USGS mineral summaries,2000-2025]. Between 2019 and 2023, the main global producers for extraction stage chromium were South Africa (50%), Kazakhstan (14%) and India (11%) and main EU suppliers were Finland (81%), South Africa (11%) and Turkey (4%). Import reliance at extraction stage was 16% between 2020 and 2024.
Based on WMD, Prodcom and Eurostat data, the average global production of processing stage chromium was 3,920 kt in chromium content between 2019-2023. Global ferrochrome production in 2023 was estimated 16,160 kt, which equals about 9,050 kt in Cr content [ICDA,2025A]. According to BGS, EU production of ferrochrome was 557 kt (312 kt in Cr content) in 2022 [Idoine et al.,2024]. Between 2019 and 2023, the main global producers for processing stage chromium were China (57%), South Africa (17%) and Kazakhstan (11%) and main EU suppliers were South Africa (33%), Finland (24%), Russia (7%) and Kazakhstan and Sweden (6%). Import reliance at processing stage was 38% between 2020 and 2024.
The world production of chromium ore is dominated by South Africa, which in 2024 accounted for about 45% of the world’s chromium ore output [USGS mineral summaries,2000-2025], two-thirds of which was exported. South Africa is the top global exporter of chromium ore, while China is by far the major importer accounting for about 80% of the world’s imports by value. After 2012, China overtook South Africa to become the world’s largest ferrochrome producer at the processing stage. Three of the four leading chromite producers, i.e., South Africa, Kazakhstan and India, are also among the four largest ferrochrome producers. Ferrochrome is produced also in Albania, Brazil, Finland, Germany, Indonesia, Japan, Oman, Russia, Sweden, Turkey and Zimbabwe [ICDA,2025A].
The global chromium market size was estimated at USD 21.5 billion in 2022 [Grandview Research,2024]. Increasing demand from the stainless steel industry for various end-use markets such as automotive, aerospace, defence, marine, building and construction, and electronics is expected to be the key growth factor (ibid.). The global chromium market is partially consolidated in nature with a few major players dominating a significant portion of the market. Key players include TNC Kazchrome JSC (Kazakhstan), Samancor (South Africa), Outokumpu (Finland), Yilmaden Holding (Turkey), Assmang Proprietary Limited, Tata Steel (India), Merafe Resources (South Africa), ASA Metals (South Africa), Odisha Mining Corporation (India), Albchrome (Albania) for metallurgical chromite. For non-metallurgical chromite, the main players include Assmang (South Africa), Dedeman Madencilik (Turkey), Eti Krom (Turkey), Oman Chromite (Oman), Rand York Minerals (South Africa), Samancor (South Africa), Glencore (UK, operating in South Africa) and Tharisa Plc (Cyprus, operating in South Africa and Zimbabwe). [Fastmarkets,2025]
EU trade
Relevant Eurostat CN trade codes for Chromium
| Mining | Processing/refining | ||
|---|---|---|---|
| CN Code | Title | CN Code | Title |
| 26100000 | Chromium ores and concentrates | 28191000 | Chromium trioxide |
| 281990 | Chromium oxides and hydroxides; excluding chromium trioxide | ||
| 720241 | Ferro-alloys; ferro-chromium, containing by weight more than 4% of carbon | ||
| 720249 | Ferro-alloys; ferro-chromium, containing by weight 4% or less of carbon | ||
| 720250 | Ferro-alloys; ferro-silico-chromium | ||
| 81122190 | Unwrought chromium; chromium powders (excl. chromium alloys containing > 10% by weight of nickel) | ||
| 811222 | Chromium; waste and scrap | ||
The listed CN codes referring to Chromium are: 2610000-Chromium Ores and Concentrates (30.6% Cr content), 28191000-Chromium trioxide (68% Cr content), 281990-Chromium oxides and hydroxide (68% Cr content), 720241-Ferro-chromium, containing by weight > 4% of carbon (56% Cr content), 720249-Ferrochromium, containing by weight <= 4% of carbon (56% Cr content) and 720250-Ferro-silicon-chromium (35% Cr content); 81122190, Unwrought chromium; chromium powders (excl. chromium alloys containing > 10% by weight of nickel) (100% Cr content) and 81122200, Chromium waste and scrap (excl. ash and residues containing chromium and chromium alloys containing > 10% by weight of nickel) (90% Cr content).
EU trade flows of Chromium CN code Ferro-alloys; ferro-chromium, containing by weight more than 4% of carbon (CN 720241) from 2000 to 2024
EU imports of Chromium CN code Ferro-alloys; ferro-chromium, containing by weight more than 4% of carbon (CN 720241) from 2000 to 2024
Figure 5 presents the import and export trend of ferrochromium, containing by weight > 4% of carbon. The EU is a net importer of ferro-chromium, containing by weight > 4% of carbon in the observed period (2000-2024). However, there is a declining trend in this period and the import of ferro-chromium, containing by weight > 4% of carbon decreased from 759,131 tonnes in 2000 to 220,225 tonnes in 2024 in Cr content. There is a sharp drop in the imports from 897,350 tonnes in 2008 to 530,017 tonnes in 2009 while the exports increased from 21,749 tonnes in 2008 to 61,903 tonnes in 2010, all in Cr content due to the global financial crisis.
Figure 6 illustrates the EU import of ferro-chromium, containing by weight > 4% of carbon from various countries. The main suppliers for import of ferro-chromium (containing by weight > 4% of carbon) during 2000-2024 were South Africa (63%) followed by Kazakhstan (10%), Zimbabwe (7%), Russia (4%), India (3%), Turkey and Albania (2%), and Rest of the World (8%). The decline in imports during 2020 and the increment in 2021, can be due to Covid-19 situation.
EU trade flows of Chromium CN code Chromium ores and concentrates (CN 26100000) from 2000 to 2024
EU imports of Chromium CN code Chromium ores and concentrates (CN 26100000) from 2000 to 2024
Figure 7 shows the import and export trend of chromium ores and concentrates. The EU is a net importer of chromium ores and concentrates. The EU exports are much lower than the EU import of chromium ores and concentrates in all years. In 2008, due to weak economy and its impact on steel production, the EU import decreased three times from 141,027 tonnes to 44,755 tonnes while the export did not change (in Cr content). The import of chromium ores and concentrates fell during 2019 and 2020 as COVID-19 pandemic happened. The imports have continued at historically low levels since. Instead, the EU exports seemed to maintain the same level during this period. In 2024, the EU exports are at 8,5 tonnes and EU imports at 64 tonnes in Cr content.
Figure 8 illustrates the EU’s import of chromium ores and concentrates from various countries. The main import partners of EU between 2000-2024 have been South Africa (68%), Turkey (18%), and the rest of the World (12%). In 2023, the majority of EU imports come from South Africa (67%), Turkey (19%) and Mozambique (9%). South Africa used to be the main supplier during 2000-2024 except in 2014 and 2017-2019 during which the import from the Rest of the World was more.
EU trade flows of Chromium CN code Chromium trioxide (CN 28191000) from 2000 to 2024
EU imports of Chromium CN code Chromium trioxide (CN 28191000) from 2000 to 2024
Figure 9 shows the import and export trend of chromium trioxide. The EU is a net importer of chromium trioxide, however the imports of chromium trioxide have been steadily regressing since 2008. Instead, the EU exports seemed to maintain the same level during this period. In 2024, the EU exports were at 400 tonnes and EU imports at 4,250 tonnes in Cr content.
Figure 10 illustrates the EU’s import of chromium trioxide from various countries. The main import partners of EU from 2000 to 2024 have been Kazakhstan (30%), Turkey (13%), South Africa (12%), United States (10%) and Russia (7%). In 2024, the majority of EU imports come from Turkey (39%), Kazakhstan (28%), South Africa (19%) and United States (11%). In 2025, Turkey increased its import share (41%), followed by Kazakhstan (24%), South Africa (20%) and United States (14%). Share of Russian imports has been very low since 2022.
EU trade flows of Chromium CN code Chromium oxides and hydroxides; excluding chromium trioxide (CN 281990) from 2000 to 2024
EU imports of Chromium CN code Chromium oxides and hydroxides; excluding chromium trioxide (CN 281990) from 2000 to 2024
Figure 15 shows the import and export trend of chromium oxides and hydroxide. The EU is a net importer of chromium oxides and hydroxide in the observed period (2000-2024). The import of chromium oxides and hydroxide declined from 16 ktonnes in 2000 to 6 ktonnes in 2024 in Cr content with some fluctuations during this period. The EU exports have been relatively stable compared to the imports, increasing in the last years. In 2024, the EU exports were at 2.5 ktonnes and EU imports at 6 ktonnes in Cr content.
Figure 16 illustrates the share of imports in the EU for chromium oxides and hydroxide from various countries. The main supplier to EU in the past two decades (2000-2024) was Kazakhstan (25%), followed by Russia (22%) UK (20%) and China (19%). The most notable trends include is the decreasing of imports from UK since 2015 and rising importance of India since 2016. In 2024, the majority of EU imports came from Kazakhstan (31%), Russia (23%), China (16%), India (16%) and United States (13%). In 2025, Kazakhstan increased its imports to 41%. Followed by China (17%), India (16%), Russia (14%), and United States (12%).
EU trade flows of Chromium CN code Ferro-alloys; ferro-chromium, containing by weight 4% or less of carbon (CN 720249) from 2000 to 2024
EU imports of Chromium CN code Ferro-alloys; ferro-chromium, containing by weight 4% or less of carbon (CN 720249) from 2000 to 2024
Figure 11 presents the import and export trend of ferrochromium, containing by weight <= 4% of carbon. During the year 2000-2024, the EU import of ferrochromium, containing by weight <= 4% of carbon had a gradual decreased with some fluctuations. There is a sharp drop in the imports in the 2008 financial crisis from 100 ktonnes in 2008 to 55 ktonnes in 2009 while the exports increased from 7 ktonnes in 2008 to 25 ktonnes in 2010, all in Cr content. In 2024, the EU exports were at 10 ktonnes and EU imports at 41 ktonnes in Cr content.
Figure 12 illustrates the share of ferrochromium, containing by weight <= 4% of carbon from various countries. The import in the past two decades (2000-2024) fluctuated rather greatly. The main supplier to EU in the past two decades (2000-2024) was Russia (45% of share), followed by South Africa, Kazakhstan, Turkey and Rest of the World (12%, 11%, 8%, and 17%, respectively). In 2024, the majority of EU imports came from Russia (33%), Turkey (20%), South Africa (13%), Kazakhstan (7%), Brazil (6%), and the Rest of the World (25%). In 2025, the importing countries’ distribution changed. Turkey’s share increased to 38%, Kazakhstan to 16%, while Russian imports were almost 0 tonnes.
EU trade flows of Chromium CN code Ferro-alloys; ferro-silico-chromium (CN 720250) from 2000 to 2024
EU imports of Chromium CN code Ferro-alloys; ferro-silico-chromium (CN 720250) from 2000 to 2024
Figure 15 shows the import and export trend of ferro-silicon-chromium. During the year 2000-2024, the EU import and export of ferro-silicon-chromium had several fluctuations especially during 2008 to 2012, there are two sharp fluctuations in both import and export. It can be due to the stop of import from some sources such as countries and territories not specified for commercial or military reasons in the framework of extra-Union trade and South Africa (in Figure 16, these imports count as Rest of the World). However, the import and export of ferro-silicon-chromium, were changed from 8,000 and 87 tonnes in 2000 to 5,000 and 194 tonnes in 2024 in Cr content, respectively. Overall, the EU import been higher than the EU export of ferro-silicon-chromium between 2000 and 2024.
The main supplier to EU in the past two decades (2000-2024) was Kazakhstan (57%), followed by Zimbabwe (16%), China and Turkey (3%), and the Rest of the World (22%).
EU trade flows of Chromium CN code Unwrought chromium; chromium powders (excl. chromium alloys containing > 10% by weight of nickel) (CN 81122190) from 2002 to 2024
EU imports of Chromium CN code Unwrought chromium; chromium powders (excl. chromium alloys containing > 10% by weight of nickel) (CN 81122190) from 2002 to 2024
Figure 13 presents the import and export trend of unwrought chromium; chromium powders (excl. chromium alloys containing > 10% by weight of nickel). During the years 2002-2024, the EU import more than doubled from 5 ktonnes in 2002 up to 13 ktonnes in 2024, while the exports increased from 4 ktonnes in 2002 to 6 ktonnes in 2011 and then remained quite stable, reaching 6 ktonnes in 2024.
Figure 14 illustrates the share of unwrought chromium; chromium powders (excl. chromium alloys containing > 10% by weight of nickel) from various countries. The import in the past two decades (2002-2024) has been dominated by Russia (71%), followed by United Kingdom (18%), China (8%) and the Rest of the World (2%). In 2024, main EU importers were Russia (53%), China (32%) and United Kingdom (13%).
EU trade flows of Chromium CN code Chromium; waste and scrap (CN 811222) from 2002 to 2024
EU imports of Chromium CN code Chromium; waste and scrap (CN 811222) from 2002 to 2024
Figure 17 presents the import and export trend of chromium waste and scrap (excl. ash and residues containing chromium and chromium alloys containing > 10% by weight of nickel). EU is net imported of chromium waste and scrap. If the imports multiplied by four from 2002 to 2006 to 4,653 tonnes, they remained stable from 2006 to 2012 and then sharply decreased down to 500-1500 tonnes per year by 2019. Since 2020, the imports have been around 200-400 tonnes per year. The exports remained low all along the period with a couple of spikes in 2009, 2014 and 2017 (about 300 tonnes). Since 2018, the exports have been 20-200 tonnes per year.
Figure 18 illustrates the share of chromium waste and scrap (excl. ash and residues containing chromium and chromium alloys containing > 10% by weight of nickel) from various countries. The import in the past two decades (2002-2024) has been dominated by Switzerland (70%), followed by Norway (10%), United Kingdom (5%) and the Rest of the World (14%). In 2025, China was the main importer with 62%, Russia (19%), and United Kingdom (17%).
Price and price volatility
Chromium is primarily traded and consumed in the form of ferrochromium (FeCr high or low carbon content) to produce stainless steel, with over 80% of the world's ferrochromium used for this purpose.
Chromium is not traded on any commodity exchange, and direct negotiations between buyers and sellers establish prices. Trade journals publish ranges of composite prices based on interviews with buyers and sellers [USGS mineral yearbooks,2000-2024], [BRGM,2017]. In contracts to ferrochrome, volumes are negotiated on an annual basis and prices quarterly. Ferrochrome is also traded on the spot market [Roskill,2014].
Chromium is traded in the form of chromium ores and concentrates, ferrochrome, chromium metal and chromium chemicals [Roskill,2014]. Ferrochromium prices should be divided between high-carbon (HC) ferrochrome, low-carbon (LC) ferrochrome and ferro-silico chromium. Chromium ores and concentrates are priced in terms of gross weight and the price depends on specifications, i.e. metal content, impurities and ore type (e.g. lumpy, friable, concentrates). Trends in chromium ores and concentrates prices follow those of ferrochrome, which accounts for 96% of chromite consumption. Non-metallurgical grades attract a price premium in comparison to metallurgical-grade chromite because of their higher chromium content and the higher degree of processing required. Prices for refractory-grade chromite are generally higher than chemical-grade and foundry-grade chromite [Roskill,2014]. Ferrochrome prices follow the trends in the stainless steel industry with a time-lag. The volatility in year-on-year changes in demand and rates for ferroalloys reflects the periods of de-stocking and re-stocking by the stainless steel industry. Prices of low-carbon ferrochrome consumed in special steels command premiums of up to 70-80% over those of charge chrome, because of their higher purity [Roskill,2014].
Ferrochrome prices escalated to historical highs from 2007 up to the first months of 2008, reflecting the strong growth in stainless steel production. The onset of the global recession at the end of 2008 led to a significant fall in the stainless steel output, which in combination with de-stocking caused a sharp drop to ferrochrome prices. In 2010 prices rebounded driven by a remarkable rise in the Chinese production of stainless steel (average chromium metal price about EUR 10,000/t). The recovery was not sustained in 2012-2013 as world demand for stainless steel in the rest of the world remained stable, supply from South Africa and China increased, and Chinese producers covered a higher percentage of the domestic market [Roskill,2014]. Within 2015, ferrochrome prices collapsed because of a downturn in the Chinese economy, contracting the demand for stainless steel, and at the beginning of 2016, chromium prices reached a six-year low (average price in 2016 about EUR 7,280/t), which had significant implications for South African industry, where ferrochrome smelters closed and mines undertook care and maintenance programs. The resulting decrease in ferrochrome supply was substantial and created a market deficit in the second half of 2016 when stainless steel demand revived in China. The shortage initiated a sharp recovery in prices which reached the levels before the global economic downturn, which in turn triggered a supply surge from producers in South Africa based on idled ferrochrome capacity and other countries such as India and Kazakhstan. In 2017, prices followed the cyclical and temporary balances of supply and demand, affected mainly by increased Chinese smelting supply, electricity tariffs in South Africa, fluctuating stainless steel demand, and industry stockpiling [KPMG,2018][Saxby,2017]. In 2018, a severe shortage of chromium alongside a strong downstream demand caused prices to hit their highest level in almost seven years [Fastmarkets,2018]. Chromite and ferrochrome prices fell below the 50th percentile of their respective cost curves near the end of 2019. The low prices were underpinned by weak markets and growing stainless steel inventories and by additional low-cost by-product chromite produced from tailings in South Africa [Backeberg,2020]. In 2020, the chromium prices averaged at lowest level since 2007, at about EUR 5,920/t. Since then the price of HC ferrochrome rose to the peak average price of EUR 14,888/t in 2022 but dropped to average of EUR 11,411/t in 2024. With the price increases, the production in the leading producer South Africa increased 7% between 2023 and 2024. However, price of chromium has decreased due to issues, such as oversupply, decreases in consumer demand, and escalating trade tensions, in the stainless steel production in China. [USGS mineral summaries,2000-2025]
Annual average price of Chromium between 2004 and 2024, in USD/t and EUR/t.
Outlook for supply and demand
The global chromium market is anticipated to expand at a compound annual growth rate (CAGR) of 5.5% from 2023 to 2030 (Grand View Research, 2024). The consumption of chromium closely follows the trends in demand for steel, and stainless steel in particular [USGS mineral yearbooks,2000-2024]. Global stainless steel consumption has increased from 1980 to 2018 at a CAGR of 5.4% [International Stainless Steel Forum,2019]. Global stainless steel consumption CAGR is expected to be 3-4 % from 2023 to 2025, however, the EU/Africa stainless steel consumption CAGR is estimated at much lower level, -19% in 2023, -5% in 2024 and 2% in 2025 [World stainless steel,2024]. Similar supply forecasts were not identified, but based on USGS ([USGS mineral summaries,2000-2025]) data, global chromium production CAGR for 2019-2024 has been around 1%.
In recent times, the production costs of ferro-chrome have risen significantly due to surging energy prices. Since energy prices are likely to continue rising in the short term, producers are looking at including these energy costs into the sales price or alternatively cutting production. Examples of recent production cuts include Albania-based GSA cutting production by 50% reducing output by about 2,000 tonnes a month. Albchrome, with a capacity of about 50,000 tonnes per year with two furnaces, or 100,000 tonnes per year with four, has already cut production by 50% because of energy costs [Patel-Campbell,2022]. South Africa, the world’s largest producer of chromium ore, has been experiencing ongoing challenges linked to the Covid-19 pandemic, shortages of truck drivers, along with energy supply issues which pose a significant threat to global supply [Patel-Campbell,2022]. However, the global chromite mine production increased 4% from 2023 to 2024, led by 7% increase in the largest producer country, South Africa. The challenges of South African chromium mining, such as electricity pricing & supply, labour costs, issues with rail and deep-level mining, still exist and could affect the future supply outlook. [USGS mineral summaries,2000-2025]
The growth in the supply of chromium ore over the last two decades has strongly followed developments in China, where the country has been increasing ferrochrome capacity (requiring imported feed} to service its stainless steel industry [Backeberg,2020]. Chinese ferrochromium and stainless steel production is affected by oversupply and decreased prices over decreased demand and trade tensions [USGS mineral summaries,2000-2025].
In the EU, the exposure to chrome ore (extraction) supply risk is driven by the high concentration of global production, the fact that a substantial share of chrome ore is consumed domestically in producing countries and therefore does not enter international trade, the structural concentration of export flows towards Asian markets, which have the capacity to absorb the major share of chrome ore, and policy uncertainty in key producing regions. Any recovery in ferrochrome smelting activity in major producing countries or further beneficiation measures would increase domestic consumption and reduce the volume of chrome ore entering international trade, constraining availability for importing regions, including the EU. [SCRREEN expert network,2026]
Within the EU, no new chrome ore mining projects are currently planned, other than the continued development of the Kemi mine in Finland, the EU’s only active source of primary chrome ore. The EU’s exposure to ferrochrome (processing) supply risk is driven by a combination of high global production and export concentration, limited domestic production capacity, and structural shifts in key supplying regions. [SCRREEN expert network,2026]
Demand
Global and EU demand and consumption
Chromium extraction stage EU consumption is presented by HS code CN 261000 Chromium ores and concentrates. Import and export data is extracted from Eurostat Comext (2025). Below, EU27 production data (Finland and Greece) are extracted from [World Mining Data,since 1984].
At extraction stage, the average apparent EU consumption between 2020 and 2024 is 335 ktonnes in chromium content (Figure 22). Based on ICDA data, the apparent average EU consumption can be calculated as 428 ktonnes between 2020 and 2024 in chromium content.
Chromium (CN 26100000) extraction stage apparent EU consumption. Consumption is calculated in metal content (EU production+import-export)
Chromium processing stage EU consumption is presented by HS codes CN 28191000 "Chromium trioxide", CN 281990 "Chromium oxides and hydroxides; excluding chromium trioxide", CN 720241 “Ferrochromium, containing by weight > 4% of carbon”, CN 720249 “Ferrochromium, containing by weight <= 4% of carbon”, CN 720250 “Ferro-silicon-chromium”, CN 21122190 “Unwrought chromium; chromium powders (excl. chromium alloys containing > 10% by weight of nickel” and CN 21122200 “Chromium waste and scrap (excl. ash and residues containing chromium and chromium alloys containing > 10% by weight of nickel)”. Import and export data is extracted from Eurostat Comext (2025). Production data is extracted from USGS (2025) and BGS (2025).
At processing stage, the average apparent EU consumption between 2020 and 2024 is 535 ktonnes in chromium content (Figure 23). ICDA calculates the average apparent consumption of ferrochrome (processing stage chromium) as 645 ktonnes and real consumption by stainless steel industry as 460 ktonnes in chromium content between 2020 and 2024.
Chromium (CN 28191000, 281990, 720241, 720249, 720250, 81122190, 811222) processing stage apparent EU consumption. Consumption is calculated in metal content (EU production+import-export)
Import reliance
Average import reliance of chromium at extraction stage is 16% and at processing stage 38% for 2020-2024.
Global and EU uses and end-uses
Chromium is mainly used in products made of stainless steel (74% in the EU). It is also used alloy steel products (19% in the EU). A small proportion is used in refractories (1% in the EU), casting molds and chemicals (both 3% in the EU) as well.
Ferrochromium (processing) end uses in the EU for 2024-2025 can be allocated to Products made of stainless steel (75%), Products made of alloy steel (20%) and Others consisting of foundry castings, superalloys, welding (5%). It is mainly used for stainless steel applications used in automotive, machinery, transport and other applications [SCRREEN expert network,2026]. 31% of chromium is used for aerospace applications [IEA,2025B].
Chromium is also essential for defense applications because it provides corrosion resistance, high-temperature strength and wear resistance that are essential for military systems. It is primarily used as an alloying element in stainless steels and high-performance superalloys for jet engines, gas turbines, naval propulsion systems, armoured vehicles and structural components, where resistance to heat, stress and oxidation is vital. Chromium is also widely used in protective surface treatments and coatings, especially in aerospace and military equipment, where chromate-based primers have historically provided unmatched corrosion protection for aircraft structures and weapons systems. [SCRREEN expert network,2026]
Global use and/or end use sectors of Chromium (2020)
European use and/or end uses of Chromium (2020)
The calculation of economic importance is based on the use of the NACE 2-digit codes and the value added at factor cost for the identified sectors.
Chromium applications, 2-digit and examples of associated 4-digit NACE sectors, and value-added per sector for 2023
| Applications | 2-digit NACE sector | Value added of NACE 2 sector | 4-digit CPA |
|---|---|---|---|
| Products Made of Chromium Chemicals | C20 - Manufacture of chemicals and chemical products | 146,000M€ | C20 - Manufacture of chemicals and chemical products |
| Casting Molds | C24 - Manufacture of basic metals | 74,046M€ | C24 - Manufacture of basic metals |
| Refractory Bricks and Mortars | C23 - Manufacture of other non-metallic mineral products | 90,000M€ | C23 - Manufacture of other non-metallic mineral products |
Value added per 2-digit NACE sector over time
Applications
all applications below
products made of stainless steel:
Chromium is used in stainless steel to enhance its resistance to corrosion, increase hardness and reduce discolouration. The chromium content of stainless steels ranges from 10.5% to 26%, with an average of 18% [ICDA,2025B] [Eurofer,2025].
Ferrochrome, the main product of chromium ore refining, is a ferroalloy providing chromium to steel production. About 80% of the ferrochrome production is transformed into stainless steel [ICDA,2025B]. The finished products manufactured by stainless steel are used in industry, architecture, transport, kitchenware and other applications covering all end-use sectors [International Stainless Steel Forum,2019].
In 2021, according to the International Stainless Steel Forum (currently Worldstainless), 38% of stainless steel was consumed in the fabrication of metal products, 29% in mechanical engineering, 12% in construction, 8% in motor vehicles and parts, 8% in electrical machinery and 5% in other transport applications [International Stainless Steel Forum,2022].
Products made of alloy steel
Considerable share of ferrochrome production (Ca. 15%) is consumed in speciality steel alloys used in industrial applications where enhanced properties are required (e.g., tools, injection moulds, camshafts, dies, bearings and mill rollers) [ICDA,2025B].
Chromium added to steel improves wear resistance, enhances corrosion and oxidation resistance, increases hardenability, and promotes strength at elevated temperatures [USGS mineral yearbooks,2000-2024].
Electrical equipment components and products made in stainless steel
Chromium is used in stainless steel to enhance its resistance to corrosion, increase hardness and reduce discolouration. The chromium content of stainless steels ranges from 10.5% to 26%, with an average of 18% [ICDA,2025B] [Eurofer,2025].
Ferrochrome, the main product of chromium ore refining, is a ferroalloy providing chromium to steel production. About 80% of the ferrochrome production is transformed into stainless steel [ICDA,2025B]. The finished products manufactured by stainless steel are used in industry, architecture, transport, kitchenware and other applications covering all end-use sectors [International Stainless Steel Forum,2019].
In 2021, according to the International Stainless Steel Forum (currently Worldstainless), 38% of stainless steel was consumed in the fabrication of metal products, 29% in mechanical engineering, 12% in construction, 8% in motor vehicles and parts, 8% in electrical machinery and 5% in other transport applications [International Stainless Steel Forum,2022].
Machinery equipment components made in stainless steel
Chromium is used in stainless steel to enhance its resistance to corrosion, increase hardness and reduce discolouration. The chromium content of stainless steels ranges from 10.5% to 26%, with an average of 18% [ICDA,2025B] [Eurofer,2025].
Ferrochrome, the main product of chromium ore refining, is a ferroalloy providing chromium to steel production. About 80% of the ferrochrome production is transformed into stainless steel [ICDA,2025B]. The finished products manufactured by stainless steel are used in industry, architecture, transport, kitchenware and other applications covering all end-use sectors [International Stainless Steel Forum,2019].
In 2021, according to the International Stainless Steel Forum (currently Worldstainless), 38% of stainless steel was consumed in the fabrication of metal products, 29% in mechanical engineering, 12% in construction, 8% in motor vehicles and parts, 8% in electrical machinery and 5% in other transport applications [International Stainless Steel Forum,2022].
Stainless steel products (used in construction mainly)
Chromium is used in stainless steel to enhance its resistance to corrosion, increase hardness and reduce discolouration. The chromium content of stainless steels ranges from 10.5% to 26%, with an average of 18% [ICDA,2025B] [Eurofer,2025].
Ferrochrome, the main product of chromium ore refining, is a ferroalloy providing chromium to steel production. About 80% of the ferrochrome production is transformed into stainless steel [ICDA,2025B]. The finished products manufactured by stainless steel are used in industry, architecture, transport, kitchenware and other applications covering all end-use sectors [International Stainless Steel Forum,2019].
In 2021, according to the International Stainless Steel Forum (currently Worldstainless), 38% of stainless steel was consumed in the fabrication of metal products, 29% in mechanical engineering, 12% in construction, 8% in motor vehicles and parts, 8% in electrical machinery and 5% in other transport applications [International Stainless Steel Forum,2022].
Products made of other steel (mainly used in constructions)
Products made of alloy steel
Considerable share of ferrochrome production (Ca. 15%) is consumed in speciality steel alloys used in industrial applications where enhanced properties are required (e.g., tools, injection moulds, camshafts, dies, bearings and mill rollers) [ICDA,2025B].
Chromium added to steel improves wear resistance, enhances corrosion and oxidation resistance, increases hardenability, and promotes strength at elevated temperatures [USGS mineral yearbooks,2000-2024].
Road Transport equipment made in other steel alloys
Products made of alloy steel
Considerable share of ferrochrome production (Ca. 15%) is consumed in speciality steel alloys used in industrial applications where enhanced properties are required (e.g., tools, injection moulds, camshafts, dies, bearings and mill rollers) [ICDA,2025B].
Chromium added to steel improves wear resistance, enhances corrosion and oxidation resistance, increases hardenability, and promotes strength at elevated temperatures [USGS mineral yearbooks,2000-2024].
Road Transportation components made in stainless steel
Chromium is used in stainless steel to enhance its resistance to corrosion, increase hardness and reduce discolouration. The chromium content of stainless steels ranges from 10.5% to 26%, with an average of 18% [ICDA,2025B] [Eurofer,2025].
Ferrochrome, the main product of chromium ore refining, is a ferroalloy providing chromium to steel production. About 80% of the ferrochrome production is transformed into stainless steel [ICDA,2025B]. The finished products manufactured by stainless steel are used in industry, architecture, transport, kitchenware and other applications covering all end-use sectors [International Stainless Steel Forum,2019].
In 2021, according to the International Stainless Steel Forum (currently Worldstainless), 38% of stainless steel was consumed in the fabrication of metal products, 29% in mechanical engineering, 12% in construction, 8% in motor vehicles and parts, 8% in electrical machinery and 5% in other transport applications [International Stainless Steel Forum,2022].
Other transport components made in stainless steel
Chromium is used in stainless steel to enhance its resistance to corrosion, increase hardness and reduce discolouration. The chromium content of stainless steels ranges from 10.5% to 26%, with an average of 18% [ICDA,2025B] [Eurofer,2025].
Ferrochrome, the main product of chromium ore refining, is a ferroalloy providing chromium to steel production. About 80% of the ferrochrome production is transformed into stainless steel [ICDA,2025B]. The finished products manufactured by stainless steel are used in industry, architecture, transport, kitchenware and other applications covering all end-use sectors [International Stainless Steel Forum,2019].
In 2021, according to the International Stainless Steel Forum (currently Worldstainless), 38% of stainless steel was consumed in the fabrication of metal products, 29% in mechanical engineering, 12% in construction, 8% in motor vehicles and parts, 8% in electrical machinery and 5% in other transport applications [International Stainless Steel Forum,2022].
Products Made of Chromium Chemicals
Products made of alloy steel
Considerable share of ferrochrome production (Ca. 15%) is consumed in speciality steel alloys used in industrial applications where enhanced properties are required (e.g., tools, injection moulds, camshafts, dies, bearings and mill rollers) [ICDA,2025B].
Chromium added to steel improves wear resistance, enhances corrosion and oxidation resistance, increases hardenability, and promotes strength at elevated temperatures [USGS mineral yearbooks,2000-2024].
Casting Molds
Chemical grade chrome consumes 3 to 5% of all chrome ore [ICDA,2025B]. Chromium chemicals are used in leather tanning, using chromium salts, mainly in the form of chromium hydroxide sulphate. Globally, around 80% of leather is chrome tanned [ICDA,2025B].
Acidic chromate, or dichromate solutions, are used in metal finishing industry for the applications of coatings to other metals, including decorative chromium plating of everyday consumer durables and hard chromium plating for engineering requirements. 80% of Chromium trioxide is used for plating [ICDA,2025B]. Other metal plating applications in which chromium chemicals are involved are anodising and chromating.
The production of chromium metal by chromium (III) oxide is an important niche application of chromium chemicals [BIO Intelligence Service,2015]. Chromium metal is used as an alloying element to specific grades of superalloys [USGS mineral yearbooks,2000-2024]. Due to their unique high-temperature and corrosion-resistance properties, chrome-nickel superalloys are employed in critical applications in the aerospace, nuclear and energy sector (e.g., gas turbines).
Chromium metal is also used in aircraft motor system as it resists high temperatures and very extreme conditions, and in certain widely used aluminium alloys as an alloying element [ICDA,2025B], [USGS mineral yearbooks,2000-2024].
Chrome chemicals are also used in pigments, timber treatment, catalysts, oil and gas, medicine and dietary supplements [ICDA,2025B].
Machinery equipment components made in other steel alloys
Foundry sands from foundry-grade chromite are used to make casting moulds to produce ferrous and non-ferrous castings
Miscellaneous (other)
Foundry sands from foundry-grade chromite are used to make casting moulds to produce ferrous and non-ferrous castings.
Other transport components made in other steel alloys
Products made of alloy steel
Considerable share of ferrochrome production (Ca. 15%) is consumed in speciality steel alloys used in industrial applications where enhanced properties are required (e.g., tools, injection moulds, camshafts, dies, bearings and mill rollers) [ICDA,2025B].
Chromium added to steel improves wear resistance, enhances corrosion and oxidation resistance, increases hardenability, and promotes strength at elevated temperatures [USGS mineral yearbooks,2000-2024].
Refractory Bricks and Mortars
refractory bricks and mortar
The high heat resistivity and high melting point makes chromite components for high-temperature refractory applications, like blast furnaces, cement kilns, moulds for the firing of bricks and as foundry sands for the casting of metals. In these applications, the refractory materials are made from mixtures of chromite and magnesite (MgCO3) – although use is declining due to environmental regulations.
Pure chromium oxide is used for high-temperature and attack-resistant refractory materials [ICDA,2025B].
Basic metal products made in other steel alloys
Products made of alloy steel
Considerable share of ferrochrome production (Ca. 15%) is consumed in speciality steel alloys used in industrial applications where enhanced properties are required (e.g., tools, injection moulds, camshafts, dies, bearings and mill rollers) [ICDA,2025B].
Chromium added to steel improves wear resistance, enhances corrosion and oxidation resistance, increases hardenability, and promotes strength at elevated temperatures [USGS mineral yearbooks,2000-2024].
Substitution
Substitution options for Chromium by application
| Use | Percentage | Substitute | Sub share | Cost | Performance |
|---|---|---|---|---|---|
| Electrical equipment components and products made in stainless steel | 28% | No substitute | 92% | No Substitute | No substitute |
| Electrical equipment components and products made in stainless steel | 28% | Fiber Reinforced Polymers/Carbon Fiber Reinforced Polymers | 5% | Very high costs (more than 2 times) | Similar |
| Electrical equipment components and products made in stainless steel | 28% | Engineering plastics | 2% | Very high costs (more than 2 times) | Similar |
| Electrical equipment components and products made in stainless steel | 28% | Carbon-based Steel | 1% | Similar or lower costs | Reduced |
| Machinery equipment components made in stainless steel | 27% | No substitute | 89% | No Substitute | No substitute |
| Machinery equipment components made in stainless steel | 27% | Fiber Reinforced Polymers/Carbon Fiber Reinforced Polymers | 6% | Very high costs (more than 2 times) | Similar |
| Machinery equipment components made in stainless steel | 27% | Titanium | 5% | Very high costs (more than 2 times) | Similar |
There are no substitutes for chromium for its main end uses even if a few percents could be subitutes at higher cost or reduced performance [USGS mineral summaries,2000-2025], [SCRREEN CRM expert network,2022], [SCRREEN expert network,2026]
Ferrosilicochrome could replace Ferrochrome [SCRREEN expert network,2026].
Electrical equipment components and products made in stainless steel
Machinery equipment components made in stainless steel
Supply
EU Supply chain
Chromium flows through the EU economy are shown in Figure 27 (2020 data) [European Commission,2024]. In the EU, chromium reserves are located in Finland (about 12.85 Mt in chromium content) and ores and concentrates are extracted only in Finland and Greece (production in Greece ended in 2020) with average production of 280 kt in chromium content 2020-2024 [Outokumpu,2025], [World Mining Data,since 1984].
Simplified MSA of Chromium flows
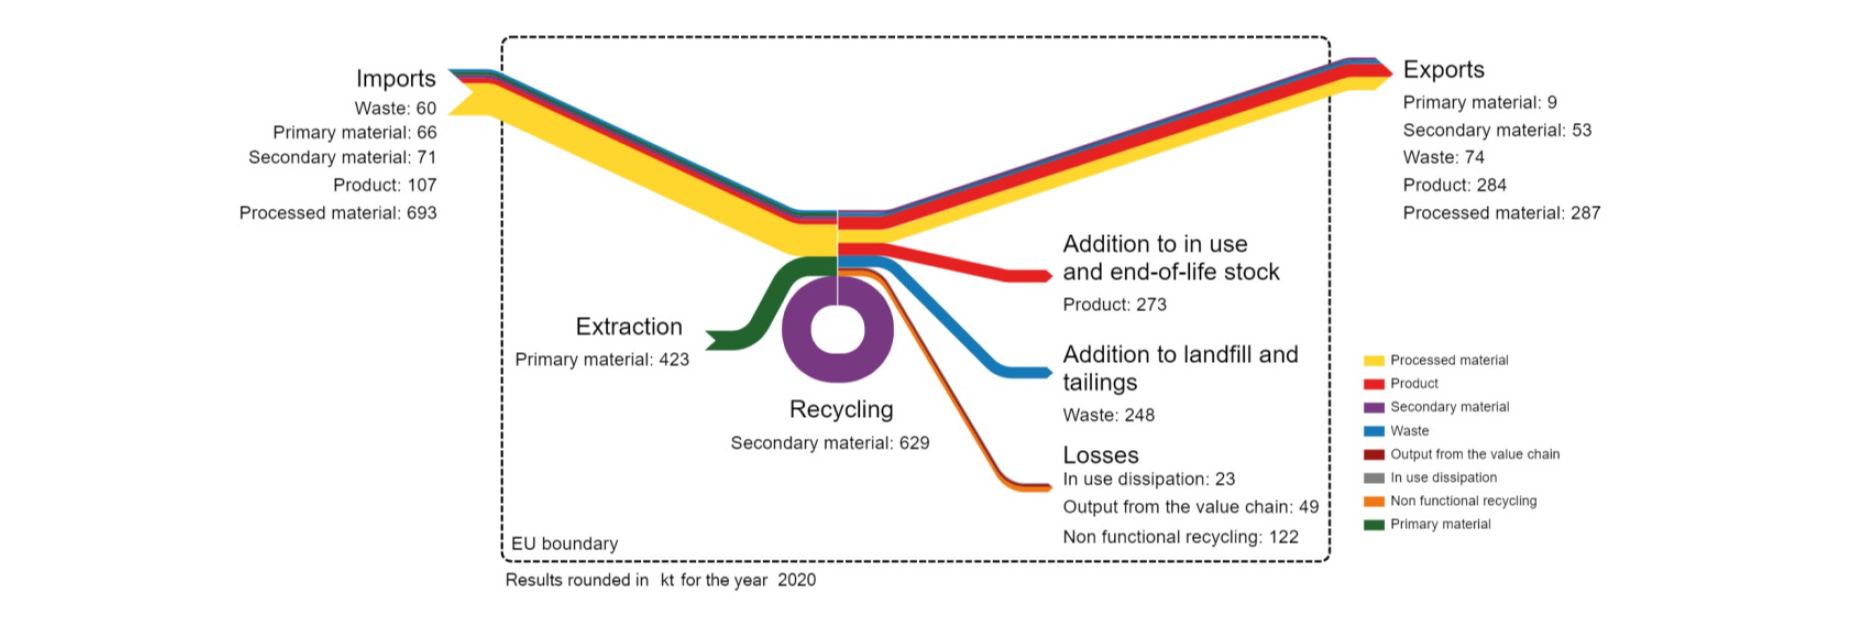
In 2020, the total EU production of chromium primary processed materials was 1,370 kt in the EU of which 970 kt (71%) in stainless steels, 360 kt in alloy steels (26%), 29 kt in foundry sands (2%), 14 kt in refractory chromite (1%) and 13 kt as disposed processing waste (1%). In total, the EU stainless and alloy steel production is supplemented by 860 kt scrap of which 561 kt is old scrap and 300 kt new scrap. Specifically, the input from old scrap from recycled end-of-life products was around 490 kt, imports of secondary material represented 71 kt, and 300 kt came from new scrap. About 160 kt of chromium in scrap were generated from the processing of steel in primary forms (“home” scrap), and directly remelted into new steel; 140 kt were generated as “new” scrap from the manufacturing of finished products. In 2020, the stock of products in use in chromium content in the EU is about 23,700 kt. The stock accumulated in landfill over the last 20 years is calculated in the MSA study at around 2,900 kt in chromium content. End of life recycling input rate for chromium in the EU is estimated at 30% for 2020. [European Commission,2024]
Supply from primary materials
EU SOURCING OF CHROMITE
In the EU, chromium ores and concentrates are currently produced only in Finland. A minor production in Greece ended in 2020 [World Mining Data,since 1984]. The average annual chromite production in the EU, was 280 kt during the period 2020-2024 in chromium content [World Mining Data,since 1984]. Outokumpu’s Kemi mine in Finland is the only operating chromite mine in the EU. The mine started production in 1968 as an open pit, and currently, all mining is underground. Ore is concentrated into upgraded lumpy ore, and fine concentrate, which are raw materials for Outokumpu’s ferrochrome works in Tornio [Outokumpu,2025B]. Based on ICDA data, about 135 kt of chromium concentrates in chromium content were imported to EU on average between 2020-2024 [SCRREEN expert network,2026].
EU SOURCING OF FERROCHROME
Ferrochrome is currently produced in Finland, Sweden and Germany by three companies. Total EU production amounted to 616 kt of ferrochrome (estimated to 345 kt in chromium content) on average in the 2018-2022 period covering 30% of EU supply, while imports of ferrochrome reached 640 kt in chromium content. South Africa is the leading EU supplier with a 41% share of EU sourcing (Figure 3). A small ferrochrome production in Romania terminated in 2010 [BGS,2025]. Based on recent ICDA data, the HC ferrochrome production in the EU between 2020-2024 was on average 306 ktonnes in chromium content. LC ferrochrome production in the EU between 2020-2024 was on average 12 ktonnes in chromium content. Ferro-silico-chrome production in the EU between 2020-2024 was on average 2 ktonnes in chromium content [SCRREEN expert network,2026].
At the integrated stainless steel plant of Tornio in Finland, operated by Outokumpu, ferrochrome production is taking place on-site with molten ferrochrome transferred and charged directly to the steel melting shop. Three smelting furnaces are operated with a capacity of 530 kt per annum after a significant expansion in 2013 [Outokumpu,2025C]. Outokumpu is the only fully integrated producer of chromite, ferrochrome and stainless steel worldwide [Roskill,2014]. Average production over 2018-2022 amounted to 489 kt of high-carbon ferrochrome. In 2022, the ferrochrome output was 430 kt. [BGS,2025]. Average production between 2020-2024 amounted 446 ktonnes, which is 250 ktonnes in chromium content [SCRREEN expert network,2026].
In Sweden, Vargön Alloys AB (owned by Yilmaden) produces high-carbon ferrochrome and charge chrome with an annual production capacity of about 240 kt HC FeCr [Yilmaden,2025]. The average ferrochrome production in 2018-2022 was 109 kt, in 2022 production amounted to 115 kt of ferrochrome [BGS,2025]. Average HC ferrochrome production between 2020-2024 averaged 101 ktonnes, which is 57 ktonnes in chromium content [SCRREEN expert network,2026].
In Germany, Afarak Elektrowerk Weisweiler GmbH operates a smelting plant producing special grades of low-carbon ferrochrome and ultra-low-carbon ferrochrome [AFARAK EWW,2019]. Production capacity is 30 kt per annum [Roskill,2014]. The average output in years 2018-2022 amounted to about 18 kt of ferrochrome [BGS,2025]. Average LC ferrochrome production between 2020-2024 [SCRREEN expert network,2026].
South Africa is the principal non-EU supplier accounting for 51% of the EU sourcing for ferrochrome in 2018-2022. Based on ICDA data, about 486 kt of ferrochromium in chromium content were imported to EU on average between 2020-2024 [SCRREEN expert network,2026].
CHROME METAL AND CHROMIUM CHEMICALS SUPPLY
Products made of chromium chemicals represent a minor volume of all chromium contained in finished products manufactured in the EU. However, these are key strategic products for the European industry, due to their use in the aviation and energy sectors.
Chromium metal is produced in France and Germany. In France, DCX Chrome in Marly has an annual production capacity of 12 kt. It is reported as the world leader in the production of high-purity, aluminothermic chrome metal with applications in superalloys, special steels, hard-facing materials, weldings, powder metallurgy and aluminium alloys [BRGM,2017], [DCX Chrome,2019]. GfE in Nürnberg, Germany, produces chromium granules, powders and lumps, and chromium alloys via an aluminothermic process [GfE,2020]. According to the US Geological Survey, capacity for chromium metal in Germany is 2 kt per year in 2022 [USGS mineral yearbooks,2000-2024].
Alventa SA in Poland produces chromium chemicals, i.e. basic chromium sulphate for leather tanning (chromal), and chrome oxide green [Alventa SA,2019]. Capacity for chromium chemicals in Poland is reported as 8 kt per year in Cr content in 2022 [USGS mineral yearbooks,2000-2024]. Cromital SPA in Ostellato, Italy, produces basic chromium sulphate for the tanning industry as well as chromic acid (chromium trioxide) and Cr (III) compounds for metal finishing and electroplating operations [Cromital,2020]. The production capacity of chromium chemicals in Italy is reported as 5 kt in contained chromium per year in 2022 [USGS mineral yearbooks,2000-2024]. Lanxess in Krefeld, Germany, produces chromium oxide for pigments from imported sodium dichromate [Lanxess,2020], [Roskill,2014]. The annual production capacity in Germany is 4 kt in 2022 (in Cr content) [USGS mineral yearbooks,2000-2024]. Finally, Spain is also among the EU countries with production capacity to produce chromium chemicals in 2017 (4 kt in Cr content) ([USGS mineral yearbooks,2000-2024].
Geology, resources and reserves
Geology
Chromium is quite abundant in the Earth’s crust. According to [Rudnick & Gao,2014], the average concentration of chromium in Earth's crust is 135 ppm, and in the upper crust 92 ppm. Chromium ore (chromite) is found mainly in ultramafic igneous rocks as a chromium spinel, a group of minerals with a highly variable chemical composition. The generic formula of chromium spinels is (Fe,Mg)(Cr,Al)2O4, a solid solution between chromite (FeCr2O4) and magnesio-chromite (MgCr2O4). 'Chromite' is used as a general term to describe chromium-bearing spinel minerals. Large variations in the total and relative amounts of Cr, Fe, Al and Mg in the lattice occur in different deposits. These affect the ore grade not only in terms of the Cr2O3 content but also in the reducibility of the ore and the chromium content of ferrochrome [ICDA,2025C]. Commercial chromites contain between 40% and 60% of Cr2O3 content with an average of about 45% [BRGM,2017]. In this factsheet, the terms “chromite“ and “chromium ore” are considered interchangeable.
Commercial chromite deposits are found mainly in two types: stratiform (bedded) in basin-like intrusions, often multiple seams through repeated igneous injections, and the more irregular podiform (pod-shaped) deposits [ICDA,2025C]. The Bushveld Complex in South Africa and the Great Dyke of Zimbabwe stratiform deposits contain the majority of the current global chromite resources. Other significant deposits of the stratiform type occur in Finland (Kemi deposit), India and Madagascar. The podiform deposits are relatively small in comparison, but chromite ores are generally more compact (hard lumpy) and less friable which is favourable for the smelting operation. They are also generally richer in chromium and have higher Cr/Fe ratios. The most important source of chromite from podiform deposits is located in Kazakhstan; other important deposits of this type are found in Russia and Turkey. Podiform ores were initially highly sought after, especially those from the deposits in Zimbabwe, as the best source of metallurgical grade chromite for high-carbon ferrochrome [ICDA,2025C].
There is a third type of chromite deposit, but it is currently of minimal commercial significance. These are the eluvial deposits that have been formed by weathering of chromite-bearing rock and release of the chromite spinels with subsequent gravity concentration by flowing water [ICDA,2025C]. Chromium may also be concentrated in high-iron lateritic deposits containing nickel, and there have been attempts to smelt these to produce chromium-nickel pig iron for subsequent use in the stainless steel industry [ICDA,2025C].
Global resources and reserves
Global Chromium resources by country
| Country | Resources (tonnes) |
|---|---|
At the end of 2018 the world’s chromium resources were higher than 12 billion tonnes of shipping-grade chromite (containing 45% of Cr2O3), equivalent to about 3.7 billion tonnes of chromium content. Based on the current level of demand, the word resources are more than adequate to meet future demand. Global chromium resources are currently heavily geographically concentrated (95%) in South Africa, Zimbabwe and Kazakhstan (Table 9). [USGS mineral summaries,2000-2025]
Global Chromium reserves by country
| Country | Reserves (tonnes) |
|---|---|
| Zimbabwe | 540,000,000 |
| Kazakhstan | 320,000,000 |
| South Africa | 200,000,000 |
| India | 79,000,000 |
| Turkey | 27,000,000 |
| Finland | 8,300,000 |
| Brazil | 6,600,000 |
| United States | 630,000 |
The identified world reserves are estimated to approximately 1,200 million tonnes of shipping-grade chromite, equivalent to about 371 million tonnes of chromium content. Zimbabwe, Kazakhstan, South Africa and India are hosts of the largest known chromium reserves. [USGS mineral summaries,2000-2025].
EU resources and reserves
EU Chromium resources by country
| Country | Classification | Quantity (Mt of ore) | Grade (% Chromium ) | Reporting code | Reporting date | Deposit, Source | |||
|---|---|---|---|---|---|---|---|---|---|
| Finland |
Measured and indicated resources in Kemi mine |
123
|
29.5 (% Cr2O3) | JORC |
1/2022 |
||||
| Known resources | 48.76 | 100% | None | 1/2022 | [NODD,2022] | ||||
| Historic resource estimate | 127 | 14.9 | None | 12/2017 | [FODD,2017] | ||||
| Greece | Historic resource estimate | 2 | 35-40 (% Cr2O3) | USGS | 11/2014 | [Minerals4EU,2019] | |||
| 5 | 35-40 (% Cr2O3) | ||||||||
| 4 | 35-40 (% Cr2O3) | ||||||||
| Sweden | Known resources | 0.167 | 100% | None | 1/2022 | [NODD,2022] | |||
The currently known JORC-compliant resources of chromium are located in Finland (Kemi mine) and amount to 24.8 million tonnes of chromium content [NODD,2022]. Newer estimates of known resources are 48.76 million tonnes in Finland [NODD,2022]. Historical resource estimates of chromium resources for Greece are from Minerals4EU project [Minerals4EU,2019].
EU Chromium reserves by country
| Country | Classification | Quantity (Mt of ore) | Grade (% Chromium ) | Reporting code | Reporting date | Source | ||
|---|---|---|---|---|---|---|---|---|
| Finland | Total reserve (not included in resources) | 62.5 | 19.8 | JORC | 1/2025 | Outokumpu, 2025 |
The JORC-compliant reserves in Finland are about 12.85 million tonnes in Cr content (Table 11), [Outokumpu,2025].
Global and EU mine production
EXPLORATION AND NEW MINE DEVELOPMENT PROJECTS IN THE EU
A project for chromite (Akanvaara project) is situated in Finland, but is not active since 2020 [Strategic Resources Inc.,2020].
CHROMITE MINING
Chromium ore is generally mined as a primary product, except for South Africa, where increasing volumes of chromite concentrates are recovered from tailings from PGM operations [Roskill,2014]. In 2023, about 18% of the world production of chromite, corresponding to about 30% of South African production, is a by-product of PGM mining in the UG2 horizon in the Bushveld Igneous Complex [ICDA,2025]. Open-pit and underground mining methods are employed for chromite mining. Underground mining of stratiform deposits is most often required but can be particularly difficult due to the thin seam thickness (less than 1.5m), weathering close to the surface and faulting. Open-pit mining is generally applied to the podiform ores at first, progressing to underground mining as deeper levels of the deposit are reached. Weathering through serpentinisation and faulting are often encountered [ICDA,2025C].
Mechanical preparation and beneficiation of crude chromite is a relatively simple process. Run-of-mine chromite is crushed to reduce the maximum particle size to less than 150 mm and then screened into four categories according to size: lumpy (25-100) mm, small lumpy (6-25 mm), chips (1-6 mm) and fines (<1mm). Lumpy and small lumpy grades are marketed directly for ferrochrome production after initial processing by hand sorting. Chips and fines are further upgraded to chromite concentrates with a higher Cr2O3 content through simple concentration techniques to remove gangue materials, e.g. gravity separation, heavy media separation, magnetic separation, froth flotation [ICDA,2025C], [Roskill,2014].
Chromium ores are traditionally classified into three types: high-chromium ores (46-55 % Cr2O3, Cr/Fe>2) used mainly in metallurgical applications; high-iron ores (40-46 % Cr2O3, Cr/Fe=1.5-2.1) used mainly in the chemical industry; and high-aluminium ores (32-38 % Cr2O3, 22-34 % Al2O3, Cr/Fe=2.0-2.5) used principally in refractories. Technological advances have enabled interchangeability among types concerning the end uses. The chromium ore is extracted, beneficiated and marketed in four distinct grades [Roskill,2014]:
- Metallurgical-grade for the production of high-carbon ferrochrome (chromite with a typical composition of 48% Cr2O3 and a Cr/Fe ratio of 3:1), and charge chrome (chromite with 40-46 % Cr2O3 and Cr/Fe ratio of 1.5-2.0) used in argon oxygen decarburisation (AOD) steel production. Technological developments in ferrochrome smelting have made possible the use of lower-grade ore fines for charge-chrome production, e.g. agglomeration pre-treatment consisting of pelletising and sintering;
- Refractory-grade (typical 47 % Cr2O3) with a combined Cr2O3+Al2O3 content of >60%, Fe<15% and silica content of around 0.7%;
- Foundry-grade (typical Cr2O3 >46%) which generally needs to be beneficiated to remove talc, silica and clay impurities.
- Chemical-grade (typical Cr2O3 44-46%, SiO2<3.5% Cr/Fe ratio 1.5-2.1)
In 2015, the highest share (96%) of the global chromite production was destined for ferrochrome production in the metallurgical industry. The chemical grade represented 2.1% of the chromite extracted, the foundry grade 1.7%, and the refractory grade 0.2% [BRGM,2017].
GLOBAL MINE PRODUCTION
The world mine production of chromium reached 9,9464 kt in chromium content as an average over 2020-2024 [World Mining Data,since 1984] (Figure 28). South Africa is the world’s largest chromium ore producer, contributing about 52% of the total world supply (average 2020-2024) [World Mining Data,since 1984]. Other important suppliers of chromium ores and concentrates are Kazakhstan (13%), India (11%) and Turkey (8%) (average 2020-2024). Chemical-grade chromite is produced in India, Kazakhstan and South Africa; refractory-grade in Oman and South Africa; and foundry-grade in South Africa and Oman (Roskill 2014).
EU MINE PRODUCTION
The EU mine production of chromium is concentrated in Finland, as the small production in Greece terminated in 2020, and is averaged at about 443 280 kt in Cr2O3 content (303 kt in chromium content) per year over 202019-20243 which is about 3% of the global mine production [World Mining Data,since 1984].
Global mine production of Chromium in tonnes
Global mine production of Chromium in tonnes
Supply from secondary materials/production
There is no specific recycling scheme for pure chromium metal, as the vast majority of chromium is used in the form of alloys. However, stainless steel which accounts for approximatively 70% of chromium’s consumption in the EU [BRGM,2017] is very well recycled. The post-consumer functional recycling of stainless steel reaches rates between 70% and 95%, depending on the product [UNEP,2011], [European Commission,2024]. In general, the scrap content in the production of stainless steel is estimated at 60%, of which 25% consists of old scrap and 35% of new scrap [BRGM,2017]. More recent estimates are 90% for content of scrap in production, 81% for EoL RIR and 82% for EoL RR for the EU27 stainless steel flows in 2023 [Glöser-Chahoud,2025]. Stainless steel is commonly recycled in separated flows as its properties will be lost if mixed with common steel scrap.
On the other hand, the detection and sorting of alloy steel products are more complicated, and thus the majority of these products ends up in carbon steel (non-functional recycling) [Deloitte,2015]. Superalloys (non-ferrous alloys containing chromium) are also recyclable in the same application if the scrap is properly sorted for the production of the same alloy.
According to data provided by the MSA study of chromium, in 2020 the collection rate at end-of-life was 83%, the overall functional recycling rate (EOL-RR) was 68% and the end-of-life recycling input rate (EOL-RIR) in the EU was 30% [European Commission,2024]. Global EoL-RIR is estimated at a lower level at 13% [JRC,2023]. In 2013, the non-functional recycling rate was 24% [Deloitte,2015].
In 2020, the total EU production of chromium primary processed materials was 1,370 kt in the EU. In total, the EU stainless and alloy steel production is supplemented by 860 kt scrap of which 561 kt is old scrap and 300 kt new scrap in chromium content. [European Commission,2024]
While chromium is recycled through stainless steel scrap, recycling does not totally substitute primary chrome ore supply. Scrap availability depends on historical consumption and end-of life variability of stainless steel products and does not respond to short-term supply disruptions or rapid demand growth. [SCRREEN expert network,2026]
Post consumer recycling (old scrap)
Material flows relevant to the EoL-RIR of Chromium
| MSA Flow | Value (kt) |
|---|---|
| B1.1 Production of primary material as the main product in EU sent to processing in EU | 330 |
| B.1.2 Production of primary material as a by-product in EU sent to processing in EU | 0 |
| C.1.3 Imports to the EU of primary material | 66 |
| C.1.4 Imports to the EU of secondary material | 71 |
| D.1.3 Imports to the EU of processed material | 693 |
| E.1.6 Products at end-of-life in EU collected for treatment | 490 |
| F.1.1 Exports from the EU of manufactured products at end-of-life | 290 |
| F.1.2 Imports to the EU of manufactured products at end-of-life | 690 |
| G.1.1 Production of secondary material from post-consumer functional recycling in the EU sent to processing in the EU | 490 |
| G.1.2 Production of secondary material from post-consumer functional recycling in the EU sent for manufacturing in the EU | 629 |
In 2020, of the 561 kt input of old scrap, 490 kt came from recycled end-of-life products and 71 kt from imports of secondary material represented. The stock accumulated in landfill over the last 20 years is calculated in the MSA study at around 2,900 kt in chromium content [European Commission,2024].
Other uses, such as leather tanning or pigments, are dissipative and chromium cannot be economically recovered, although various hydrometallurgical processes are known for chromium depollution and decontamination [Dhal,2013].
Industrial recycling (new scrap)
Of the 300 kt of chromium that came from new scrap In the EU in 2020, about 160 kt of chromium in scrap were generated from the processing of steel in primary forms (“home” scrap), and directly remelted into new steel. 140 kt were generated as “new” scrap from the manufacturing of finished products. Around 49 kt leave the value chain in the form of ferrochrome production slag and is reused non-functionally in applications such as construction. [European Commission,2024].
Processing
Ferrochrome is an alloy of chromium and iron made using metallurgical grade chrome ore. It contains 45% to 75% chromium by weight with much smaller amounts of carbon and silicon which determine the grade or type of alloy. Depending on the level of carbon in the alloy, ferrochrome can be divided into three categories [NRC,1995]: high-carbon (HC) ferrochrome (carbon content between 4% and 9%), low- and medium-carbon (LC & MC) ferrochrome (carbon content less than 0.5% for LC and between 0.5% and 4% for MC), and ferrochrome-silico-chrome (FeSiCr).
According to ICDA [ICDA,2021], 94.5% of the global ferrochromium alloys production in 2021 comprised high-carbon and charge chrome, 0.2% medium-carbon ferrochrome, and 5.3% low-carbon ferrochrome.
Ferrochrome alloys are produced from metallurgical-grade chromite by smelting a mixture of the ore (in the form of lumpy ore, fines or concentrates), a reductant (e.g. coke) and auxiliary flux materials in an electric arc furnace. AC arc, DC arc (or plasma) furnace technology can be used for the high-temperature reduction (smelting). The smelting process is electrical-energy intensive requiring up to 4,000 kWh per tonne of material weight with the efficiency varying with ore grade, operating conditions, and production process [ICDA,2025C].
Depending on the different production routes and the desired carbon content of the ferrochrome, carbon or silicon is used as a reducing agent. For the production of HC FeCr, carbon is added to the process as a reducing agent, predominantly metallurgical coke (with a low phosphorus and sulphur content). The most common modern method of production of HC FeCr with high chromium content is smelting in submerged electric arc furnaces. The basic principle of electric furnace smelting of HC FeCr is to reduce chromium and iron oxides with carbon. For the production of LC FeCr, ferro-silicon-chromium and ferrosilicon are used in a silicothermic reduction as reducing agents and raw material. The most commonly used processes to manufacture low carbon ferrochrome are metallo-thermic reductions known as the Duplex (Perrin) or Simplex processes. MC FeCr can be produced by the silico-thermic reduction of chromite ore and concentrates or by the decarburisation of HC FeCr in an oxygen-blown converter. The silico-thermic route is more economic and therefore more important today for producing MC FeCr. This may be because of the low demand for MC FeCr compared to the high demand for HC FeCr. LC FeCr can be produced by the same process.
Chemical grade chrome ore represents 3 to 5% of the global chrome ore output, used by the chrome chemical industry [ICDA,2025B]. Chemical-grade chromite ore is processed, together with soda ash (sodium carbonate) by a rotary kiln roasting process to produce sodium chromate. The sodium chromate is then converted into a variety of chromium chemicals such as sodium dichromate, chromic acid and chromium oxide, which are subsequently manufactured into other chromium compounds (such as chromium (III) oxide) (Figure 29).

Figure 29. Typical flow sheet for chromium chemical production [Fei and Liu,2016].
Pure chromium metal is produced primarily through the aluminothermic process by the reduction of chromium (III) oxide and by the electrodeposition process using a wide variety of electrolytes [NRC,1995]. Chromium metal standard grades range from 99% to 99.4%, but it typically contains more than 99.5% chrome [ICDA,2025C].
Other considerations
Health and safety issues
Chromium may be found in different oxidation states, with CrII, CrIII and CrVI as most common compounds. While the first two compounds may be considered relatively harmless, in its sixth oxidation state, chromium becomes a hazardous compound. CrVI is under REACH Annex XIV (List of substances for authorization). Exposure to CrVI through ingestion or inhalation may indeed result in various types of physiological damages: ulcerations (cuts and abrasions of skin, ulcerations of the nasal septum), dermatitis (skin irritation and sensitization), acute respiratory effects (irritation of mucous membranes), carcinogenic effects (e.g. lung cancer), and effects in other organs (e.g. necrosis of kidneys). To prevent any potential risks of exposure to CrVI, the ILO recommends to suppress dust and mist containing CrVI as far as possible, e.g. through wet cleaning [ILO,2011], or adequate ventilation.
Sodium chromate is a substance of very high concern and is listed as entry 22 on REACH ANNEX XIV (List of substances for authorization) due to its mutagenicity, carcinogenicity and toxicity for reproduction. Chromium VI compounds are included in REACH Annex XVII. The placing on the market and use in certain products/applications of these substances is therefore restricted. For example, “cement and cement-containing mixtures shall not be placed on the market, or used, if they contain, when hydrated, more than 2 mg/kg (0.0002 %) soluble chromium VI of the total dry weight of the cement” [ECHA,2021].
Canada published technical guidelines related to the presence of chromium in drinking water, i.e. a maximum acceptable concentration of 0.05 mg/L (50 µg/L) is established for total chromium in drinking water [Government of Canada,2018].
Environmental issues
In a life cycle perspective, the environmental impacts of chromium production on a per kilogram basis range among the lowest of the metals sector (out of 63 metals) considering the global warming potential, cumulative energy demand, terrestrial acidification and freshwater eutrophication impact categories, 2.4 kgCO2eq per produced chromium product (weighting of impacts based on use percentages, e.g. mainly FeCr for chromium). However, when considering the global annual chromium production volume (which is relatively significant compared to other metals), the impacts in terms of global warming potential appear among the highest of the metals sector (11th out of 63). [Nuss and Eckelman,2014]. For FeCr, environmental impacts are mainly associated with local energy production and are estimated 10 kgCO2eq per produced HC FeCR kg and 17.1 kgCO2eq per produced LC FeCr, which are much higher than those reported in Nuss and Eckelman [ICDA,2020]. Climate impacts of European production of HC and LC FeCr are considered lower than the global averages presented by ICDA, Outokumpu reported 3.34 CO2eq/t for HC FeCr in 2023 [Outokumpu,2025A].
From a process perspective, the environmental impacts of chromium production are primarily induced by purification and refining operations, while mining/concentration operations have limited contributions to these impacts [Nuss and Eckelman,2014].
Normative requirements
The maximum discharge limit to the aquatic environment in the EU are 1 and 5 mg/l for CrVI and Cr(total), respectively [Vaiopolou et al.,2020].
Zimbabwe issued a local regulation related to chromium mining, where this sector is one of the main contributors to the national economy. In 2018, the government first introduced a two-week ban, following reports of dangerous and destructive chrome mining operations. The ban was then deleted, “on the condition that chromium mining operations adhere to new regulations […] Chrome miners will … be obliged to rehabilitate land damaged by operations once mines have been exhausted, and mining companies will have to employ managers on permanent contracts to monitor and control mining activities”. [Mining Technology,2018].
Zimbabwe has imposed export ban on chromium ores since 2021. South Africa, China and India have licencing requirements for chromium in place. [OECD,2024A]
EU restricts Cr(VI) substances under REACH to protect human health and the environment. In the ECHA restriction proposal, CR(VI) is proposed to be banned in the European Economic Area unless in specific listed industrial use categories. [European Commission,2025A]
Socio-economic and ethical issues
Economic importance of the Chromium for exporting countries
Table 14 lists the countries for which the economic value of exports of chromium (assessed separately for chromium ores and concentrates and ferrochrome) represents more than 0.1% of the total value of their exports [OEC,2025].
Share of the Chromium export market vs the total export market for the most contributing countries
| Commodity | Country | Export value (USD) | Share in total exports |
|---|---|---|---|
| Chromium ores and concentrates | South Africa | 6.29B | 4.1% |
|
Albania |
0.118B | 2.8% | |
| Zimbabwe | 0.217B | 2.4% | |
| Papua New Guinea | 0.046B | 0.4% | |
| Pakistan | 0.122B | 0.3% | |
| Turkey | 0.422B | 0.2% | |
| Kazakstan | 0.117B | 0.1% | |
| Ferrochrome | Zimbabwe | 0.458B | 5.1% |
| Albania | 0.174B | 4.1% | |
| South Africa | 4.83B | 3.1% | |
| Kazakstan | 1.83B | 1.9% | |
| Finland | 0.318B | 0.4% | |
| India | 1.11B | 0.03% | |
| Oman | 0.076B | 0.01% |
Social and ethical aspects
Not identified.
Research and development trends
Research and development Trends for Low-carbon and green technologies
Production of chromium products such as ferrochrome requires considerable amounts of energy. Alternative research and development avenues for decarbonisation of the chromium production process include:
- Hydrogen plasma smelting based and direct hydrogen based reduction [Jafarzadeh et al.,2026]
- Biocarbon as a reducing agent [Swerim,2024]
- Low emission ferrochrome by decarbonisation of production and transport for 67% lower emissions [Outokumpu,2025A]
- Slag utilisation: Use of ferrochrome slag for green aggregate material in concrete [Al Hindasi et al.,2025]
- Deposition of black chromium coating for solar thermal application, [Wen et al.,2023]
Other Research and development trends
Many chromium related EU research projects focus on substituting Cr(VI) in various applications and chromium recovery from industrial waste.
ReMFra: Recovering metals and mineral fraction from steelmaking residues (2022-2027) [ReMFra,2026]
ReMFra project aims to develop a process that will allow the valorisation of steelmaking residues, which will be tested and validated in an industrial-scale demonstration plant.
Mozart project: Metal matrix nano-composite coatings utilization as alternative to hard chromium (2022-2026) [MOZART,2026]
MOZART project aimed to develop nanocomposite coatings poised to transform the surface treatment industry by showing equivalent performance to hard chromium, with improved safety and sustainability.
CHROMA project:- Mobilization of chromium by organic matter in reduced systems (2022 – 2024, EU)
Long-term pollution mitigation measures require a better understanding of the biogeochemical processes that regulate the behaviour of trace metals, such as chromium, over time. While stable chromium isotopes can be used to effectively assess the element’s biogeochemical and redox cycles, few studies have investigated the ligand-induced chromium mobilisation mechanism. The CHROMA project will investigate whether chromium can be mobilised by organic ligands under various environmental conditions. To this end, it will combine field sampling, isotopic analysis and geochemical modelling. Project results will help reveal more about how organic ligands affect the chromium redox cycle and how anthropogenic activities impact the subsurface environment.
Cr VI FREE COATING project: Development of an innovative alternative to the use of hexavalent chromium in the aerospace coating (2018, EU)
The project aimed to develop the first green, anticorrosion primer for aircraft structures. Hexavalent chromium has been widely used as an anticorrosive agent in primers applied on structural airframe components. Despite its durability and long-term corrosion resistance, it causes adverse health effects. The EU-funded Cr VI FREE COATING project is developing a water-based primer free of carcinogenic compounds. The first-of-its kind coating will be easily sprayed onto large aerospace parts with a long pot life exceeding 4 hours and with reduced concentrations of volatile organic compounds. Furthermore, researchers are designing droplet tests to reduce the time of primer effectiveness testing from 3,000 to 168 hours.
An environment-friendly chromium electrodeposition process using additive-laden deep eutectic solvent [Brusas et al.,2023]
The development of safer and more sustainable electrochemical processes has been one of the promising applications of deep eutectic solvents. In this study, a trivalent chromium-ethaline deep eutectic solvent electrolyte with the incorporation of significant plating additives such as water, boric acid, and lithium chloride was developed for chromium electroplating application. The effect of the selected plating additives on the morphology of the chromium deposits was mainly investigated.
Statistical analysis and profiling of chromium leaching characteristics in Basic Chrome Sulphate (BCS) sludge dumping at Khanchandpur-Rania, district Kanpur Dehat, Uttar Pradesh (India), [Kumar et al.,2023]
The present investigation has been conducted to study the leaching behaviour of chromium species in immobilised hazardous waste containing Basic Chrome Sulphate (BCS) dumped at Khanchandpur-Rania, Kanpur Dehat district of Uttar Pradesh, India. Results indicated that the concentration of total and TCLP-based Cr and Cr 6+ increased with depth. A similar trend was also observed in total and TCLP-based Cr 3+, total Fe, total Mn and TDS contents, which strongly justified the leaching characteristic of salts increasing with the increasing depth level of the dumpsite.
Insight to chromium homeostasis for combating chromium contamination of soil: Phytoaccumulators-based approach [Pandey et al.,2023]
Chromium (Cr) is a naturally occurring, carcinogenic heavy metal that has become a pressing concern in recent decades for environmentalists. Due to high anthropogenic activities, the concentration of Cr has crossed the environmental threshold levels and consequently contaminated soil and water. The high solubility of Cr ions in the groundwater results in its high uptake by the plants leading to phytotoxicity and yield loss. The dearth of efficient and cost-effective treatment methods has resulted in massive chromium pollution. However, some phytoaccumulators capable of accumulating Cr in high amounts in their shoots and then performing their metabolic activity typically have been identified. Chromium bioremediation using phytoaccumulators is very contemplative due to its eco-friendly and cost-effective outcome. These accumulators possess several mechanisms, such as biosorption, reduction, efflux, or bioaccumulation, naturally or acquired to counter the toxicity of chromium. This review focuses on the detoxification mechanism of Cr by the phytoaccumulator species, their responses against Cr toxicity, and the scope for their application in bioremediation.